FTSE dips below 50 day moving average
The FTSE 100 index (daily chart) has dipped below its 50-day moving average for the first time since late April, providing an early indication of […]
The FTSE 100 index (daily chart) has dipped below its 50-day moving average for the first time since late April, providing an early indication of […]
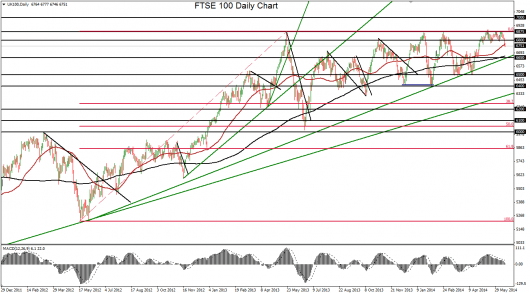
The FTSE 100 index (daily chart) has dipped below its 50-day moving average for the first time since late April, providing an early indication of a potentially deeper pullback that should be due for the UK equity index. The current decline helps to validate the major resistance zone around 6875-6885 that has been firmly in place for more than a year. Since the long-term high of 6896 was hit recently in mid-May – the highest peak in almost 15 years – the index has repeatedly retested that resistance zone but has been unable to surpass it.
Having just fallen significantly below that resistance and tentatively dropping below the noted 50-day moving average, the FTSE could well be forming an overdue pullback. A substantial pullback within the long-term bullish trend has not occurred since the index declined by more than 5% in late February and March.
Any further bearish momentum on the current downside move should find major support around the 6650 level, which is also where a long-term uptrend support line and the 200-day moving average are approximately situated. A further breakdown below that support confluence would suggest a potential correction, with key downside support around 6500. To the upside, any turn back up and significant breakout above the noted resistance zone and multi-year high would confirm a continuation of the long-term bullish trend, with a further upside target around the 7000 psychological level.
