FTSE climbs to multi year resistance again
The FTSE 100 index (daily chart shown below) has hit major resistance around the 6875-6885 zone for the third time since the multi-year high of […]
The FTSE 100 index (daily chart shown below) has hit major resistance around the 6875-6885 zone for the third time since the multi-year high of […]
The FTSE 100 index (daily chart shown below) has hit major resistance around the 6875-6885 zone for the third time since the multi-year high of 6896 in mid-May – which established the highest peak in almost 15 years.
This most recent attempt to break the exceptionally solid resistance barrier saw the UK equity index climb to a high of 6875 on Friday before pulling back slightly and consolidating its gains.
The 6875-6885 resistance area has held strongly since May 2013 as the index has reached or closely approached it at least seven times during the course of more than a year, each time turning back down from resistance.
Last week’s approach of that resistance zone constituted a rebound from the recent pullback to major support at 6700 in late June.
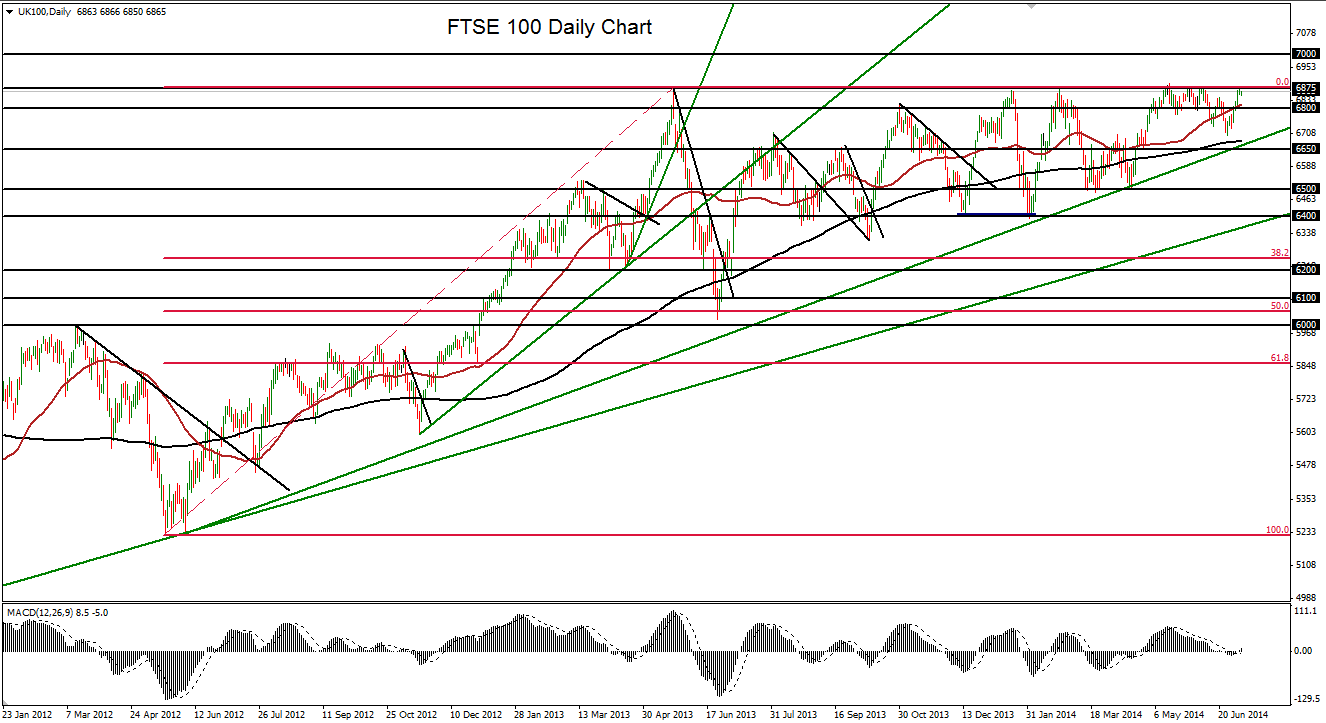
Like its US and global equity index counterparts, the FTSE 100 has been overbought and overdue for a deeper, more substantial pullback or correction for several months but overall market sentiment has remained defiantly bullish.
Any extension of this marked bullishness with a strong breakout above the noted resistance zone would confirm a continuation of the long-term uptrend, with a clear upside target at 7000.
To the downside, if the FTSE continues its failure to break resistance, a deeper pullback could likely ensue with key support objectives at 6650 and 6500.
