FTSE bears ignore soft options ahead of Brexit vote
Despite the FTSE 100′s 3% jump on Monday, Thursday’s risk event continues to promise extreme moves whatever the outcome.
Despite the FTSE 100′s 3% jump on Monday, Thursday’s risk event continues to promise extreme moves whatever the outcome.
In fact, surging stocks, sterling currency pairs and bond yields, whilst welcome, also underline how vulnerable markets are to fresh adverse stimuli (like another swing in referendum polls, perhaps).
For instance, jitters were well evidence on Tuesday afternoon, particularly in sterling, when the latest Brexit soundings trimmed Remain’s razor-thin lead even further.
They’re even warier, after the FTSE’s whipsaw a couple of weeks ago, a pattern normally only seen in currency markets.
Many equity investors closed-out after that, perhaps only to buy back in this week, at a cost.
So what about investors wishing to remain exposed to the FTSE, despite pronounced risks? After all, the FTSE is often an essential hedge and an easy way to capture freak jumps across blue chips, like Monday’s.
Options are one solution for such situations. And given that the referendum could be the biggest ‘binary’ event markets have seen for decades, index options can tell us a lot about how the world’s biggest investors are managing stock market risks.
FTSE options have understandably been in demand, though, as per sterling, that demand pushed premiums to multi-year highs, chilling the market a bit, before buying picked up again this week.
Among nearer-term deals, the most traded option early in the week was Intercontinental Exchange’s (ICE) 6500 call, expiring on 15th July.
Its premium almost doubled on Monday, but that’s where the clear logic of such trades goes a bit wrong.
That’s because even if the FTSE rose about 330 points from its Monday close, the 6500 deal would only break-even.
On that basis, perhaps we should assume FTSE option bulls have either thundering conviction, or are just foolhardy.
After all, the minimum lot of 10, costing, £370 would only return a fair profit if the FTSE rose to 6741.13 (or higher)—500 points away from Monday’s close.
What are the chances?
The highest open interest, according to ICE data checked on Tuesday, was 51,848 for puts on 5000, expiring in December.
The most bought calls, with 49,374 contracts outstanding, had a 6000 strike, expiring in September.
The most active puts also expire on 15th July, with a 5700 strike and open interest of 19,323. They outnumber the calls on 6500, where open interest is 11,496.
Puts on 5100, 5500, 5800, 5900 and 6000 in July and later months are also busy, though in lower numbers, skewing the entire curve bearish.
Premium for the mid-July 5700 put is an even more punishing £500 per lot. And a 554 point FTSE slide to 5650 would still leave the option worth zilch.
Once more, we could conclude that FTSE option bears have either great conviction, or poor-judgement.
But more plausibly, this recent surge in FTSE options likely buttresses existing hedges and other positions, with elevated cost not proving a barrier, judging by the £1.2bn in notional value on the 5700 put alone.
Given strong links between the main FTSE options market and FTSE futures, let’s examine how trading patterns we outline above may impact ICE’s FTSE index future from a technical basis.
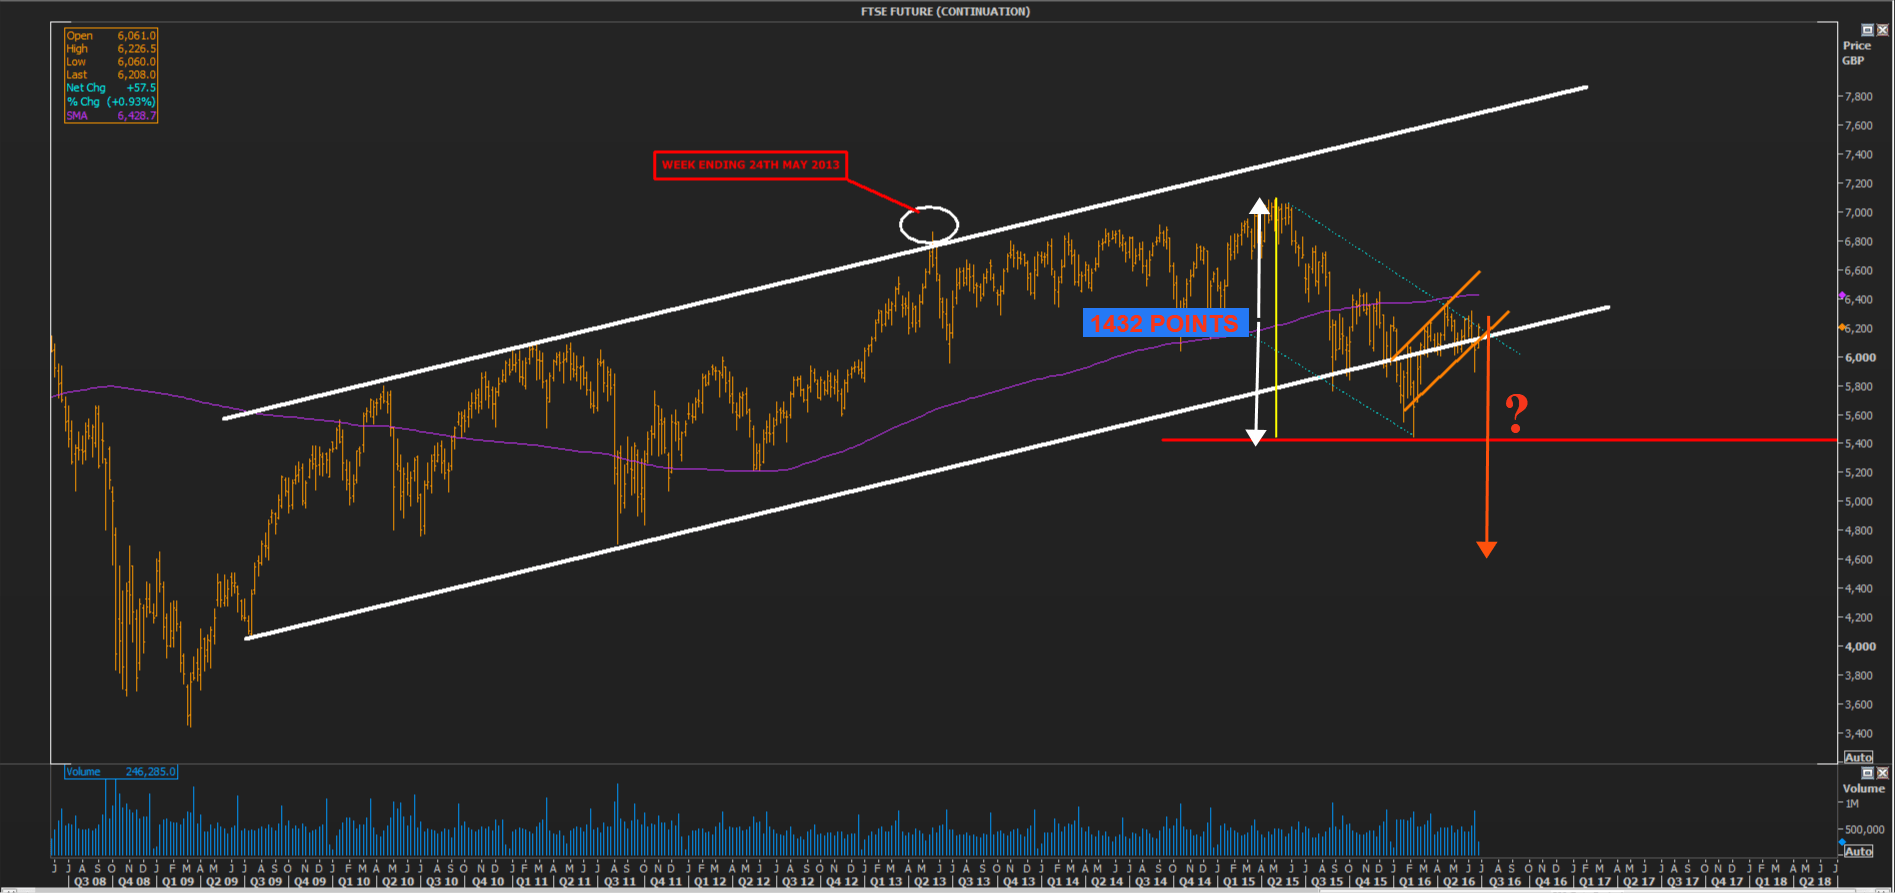
Obviously, the most important aspect to note is the long-term channel that the index largely respected between July 2009 and August last year.
However, for most of the lifetime of this channel, we should also note that the index was supported by its 200-week moving average (dark lilac line). That support also gave way in August 2015, triggering a decline that lasted till February this year, with pronounced and continuing spikes out of the range for the first time.
These repeated violations of the channel may suggest the trend has been invalidated and that the index will begin a long-term downtrend before too long.
The clearest warning that this has occurred will be the FTSE Future’s failure to sustainably re-establish itself within the smaller upward (orange) pennant, this week and next.
The picture is ambiguous because the longer term trend was capped by a large flag formation that might point to a bullish continuation, whilst the larger flag is itself waving a shorter flag that is theoretically bearish.
Calculating the length of the shorter flag pole using the prescribed method, we measure from the future’s all-time trading high of 7085.5 during the week ending 1st May 2015 to the low at 5653.5 during the one ending 12th February.
This gives a distance of 1432 index points. The length is illustrated by two opposing white arrows in the chart below.
Should the flagpole be even an approximate analogue of the length of any continuation, the index would break through the channel, and past support established at 5653.5 in February.
We can see that the FTSE Future has subsequently risen back into the shorter channel for now.
But it is currently being challenged by the upper wall of the larger flag and triangulation from at least two directions, suggesting a breakout, though the likely direction of the move is unclear.
However, if the larger flag proves to be a valid (and more powerful) precursor of continuation, the FTSE Future’s uptrend will remain intact.
For now, neither the call nor the put, detailed above, are returning a profit. Whilst the chances of them doing so by their 15th July expiry seem balanced, the medium-term direction of the FTSE Future should be clearer before then, depending on how it meets the challenges we outline here.