FTSE backs off from multi year highs
The FTSE 100 index (daily chart shown below) has backed off from major multi-year resistance around the 6875-6885 price zone. This key resistance area has […]
The FTSE 100 index (daily chart shown below) has backed off from major multi-year resistance around the 6875-6885 price zone. This key resistance area has […]
The FTSE 100 index (daily chart shown below) has backed off from major multi-year resistance around the 6875-6885 price zone.
This key resistance area has been tested multiple times within the past year but has not been breached substantially to the upside as of yet.
A high of 6896, just slightly above this resistance area, was reached three weeks ago in mid-May, forming a decade-long record high before pulling back.
Another attempt to continue the long-term bullish trend was made just last week, but the index once again could not muster the strength to break the noted resistance zone, turning back down from a 6882 high.
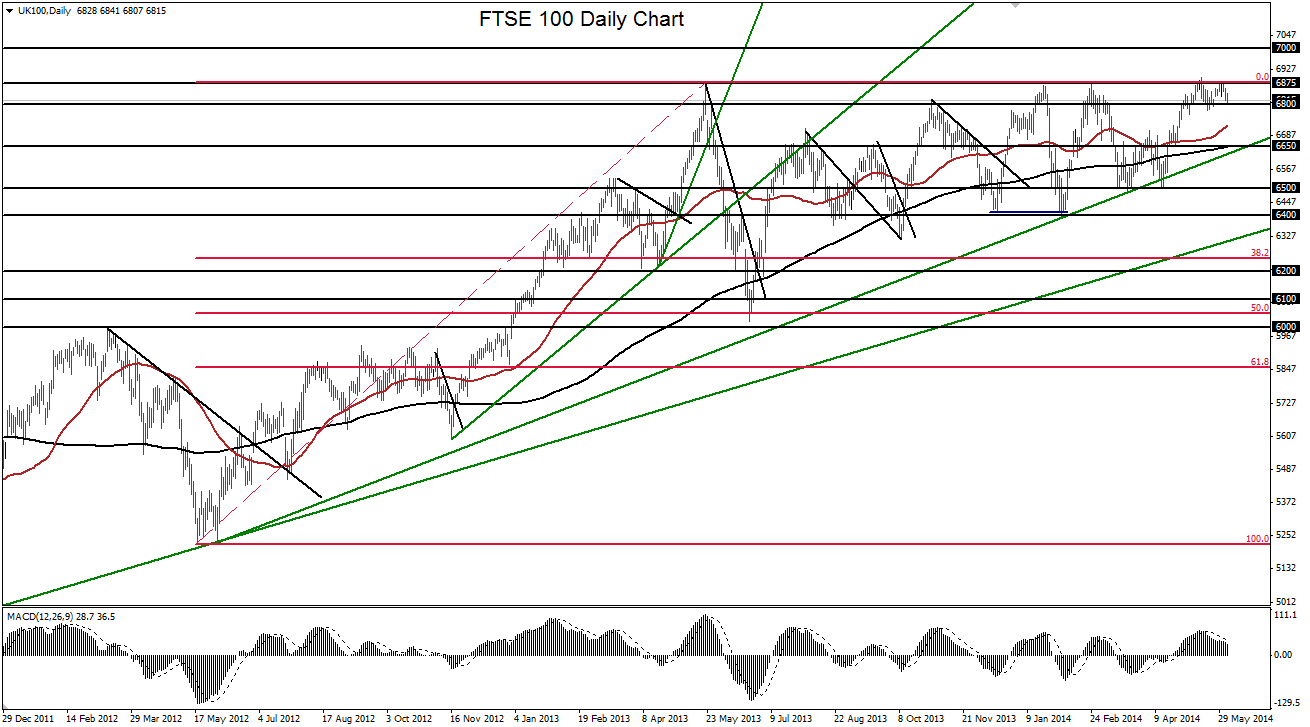
Trading well above both its 50-day and 200-day moving averages, as well as above a long-term rising trend line, the FTSE continues to be firmly entrenched in a strong bullish trend.
It should, however, soon be due for a deeper pullback.
A significant pullback has not occurred since the index declined by more than 5% in late February and March. For any impending pullback, key support targets currently reside around 6700 and 6650.
Further to the downside is major support around the 6500 level.
To the upside, any substantial breakout above the noted decade-long high would confirm a continuation of the long-term bullish trend with a further upside target around the 7000 psychological level.
