FTSE Another short covering bounce for stocks
At the time of this writing on Friday morning, equities were witnessing some rare green price action in a rather quiet session. The major indices […]
At the time of this writing on Friday morning, equities were witnessing some rare green price action in a rather quiet session. The major indices […]
At the time of this writing on Friday morning, equities were witnessing some rare green price action in a rather quiet session. The major indices here were up around 1 to 1.5 per cent and US index futures pointed to a firmer start on Wall Street. Compared to the recent sharp falls, today’s bounce represents a mere drop in the ocean. We are not out of the woods just yet as like the previous occasions this may well prove to be just a short-covering bounce, but it is a welcome relief nonetheless. The major indices are either bouncing off key technical support levels or exhaustion points after the recent sharp falls. Some bearish traders seem happy to book profit as they don’t want to go into the weekend holding a position, knowing full well that there is a good chance for a central bank intervention, or some sort of production agreement among the key oil exporting countries in an effort to boost prices.
It is also a much busier week for economic calendar next, so there is more of an incentive for profitable shorts to lighten up their positions or risk giving back hard-earned unrealised profits. Of course, there can be good reasons for some bullish speculators to tip their toes in around these severally oversold levels, too. Some would argue that the global economy is not as bad as people make it out to be, while the central banks’ desire to hold rates at or around zero is good news for higher-yielding stocks. For now however, the bulls are being very nimble as they are fully aware of the possibility for a much larger correction, now that the major indices are in bear territory (20% off highs).
This afternoon’s focus will be on US retail sales and consumer sentiment data. Any positive surprises there could give stocks a further boost and help to lift the dollar. Traders who are fans of inter-market relationships are aware that the USD/JPY for example tends to correlate positively with equities and EUR/USD negatively. Thus, if the dollar rises as a result of positive US economic data then stocks could benefit, at least in the short-term anyway. In Europe, the main news this morning was from Germany where the fourth quarter GDP came out in line with the expectations at +0.3 per cent. This helped to reduce concerns that Europe’s economic powerhouse suffered more profoundly than feared due to the slowdown in China. Likewise, the Eurozone GDP was in line with the expectations, as it ‘expanded’ 0.3 per cent over the quarter. But a surprisingly sharp 1% drop in Eurozone industrial production in December was a concern, although ironically this had a positive indirect impact on stocks as it weighed on the EUR/USD exchange rate slightly. In the UK, construction output rose 1.5% month-over-month, but this was also weaker than 2.1% expected.
Helping the German DAX was Commerzbank which rallied some 12% after reporting better than expected results. Other noteworthy European companies which reported better-than-expected earnings results included Renault and Rolls Royce. The latter surged 13% to the top of the FTSE 100 despite halving its dividends. This is the first time RR has cut dividends in almost 25 years. A rebound in commodity prices meant miners would also dominate the top of the FTSE.
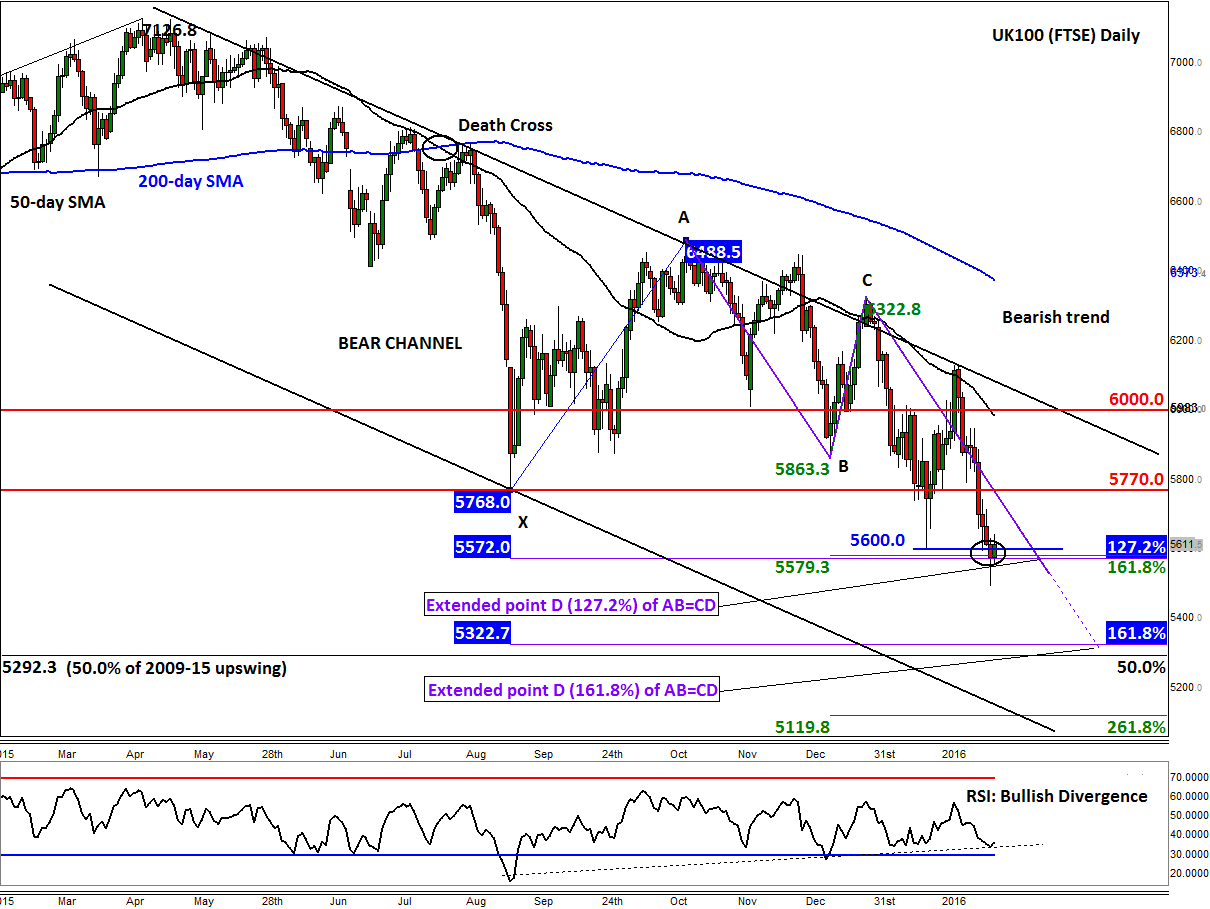
As mentioned, the major indices have reached or neared key reference points or exhaustion levels now. The S&P 500 for example has been bouncing around the key 1800/20 area, which has been strong support in the past. For the FTSE, the area around 5570 marks an exhaustion point, which may help explain why the UK benchmark stock index has bounced this morning.
As can be seen from the daily chart of the FTSE, below, this 5570 level is where the 127.2 and 161.8 per cent Fibonacci extension levels of the previous corrective upward moves come into play. An extended (127.2%) point D of an AB=CD pattern also comes into play there. Meanwhile, the momentum indicator RSI has been making higher lows recently, indicating that the selling pressure may be waning. All of these technical indications point to a potential short-term bounce, which may well be underway now.
That being said, the overall trend is clearly bearish and any short-term bounces should be taken with a pinch of salt. The FTSE is stuck inside a large bearish channel, and is also below its main moving averages and other key resistance levels. The bulls should remain nimble, therefore.
Going forward, some of the key resistance levels to watch include 5770 and then 6000, levels which were previously support and/or resistance. Only a break above the bearish trend would be deemed a strong bullish outcome. Until and unless that happens, the path of least resistance remains on the downside. The next potential bearish target below 5570 could be around 5290-9325. This area marks the 161.8% extended point D of the AB=CD pattern, the 161.8% extension of the XA move and the 50% retracement level of the entire 2009-15 upswing.