FTSE 8217 s Ominous Yield Similarities with 2007
There’s never a shortage of comparisons with 2007 when it comes to equities. Comparing chart patterns, price-earnings ratios, earnings outlooks, interest rate environments and other […]
There’s never a shortage of comparisons with 2007 when it comes to equities. Comparing chart patterns, price-earnings ratios, earnings outlooks, interest rate environments and other […]
There’s never a shortage of comparisons with 2007 when it comes to equities. Comparing chart patterns, price-earnings ratios, earnings outlooks, interest rate environments and other factors in the macroeconomic landscape with the fateful autumn 2007 has almost become a profession. Most comparisons with bearish implications proved false.
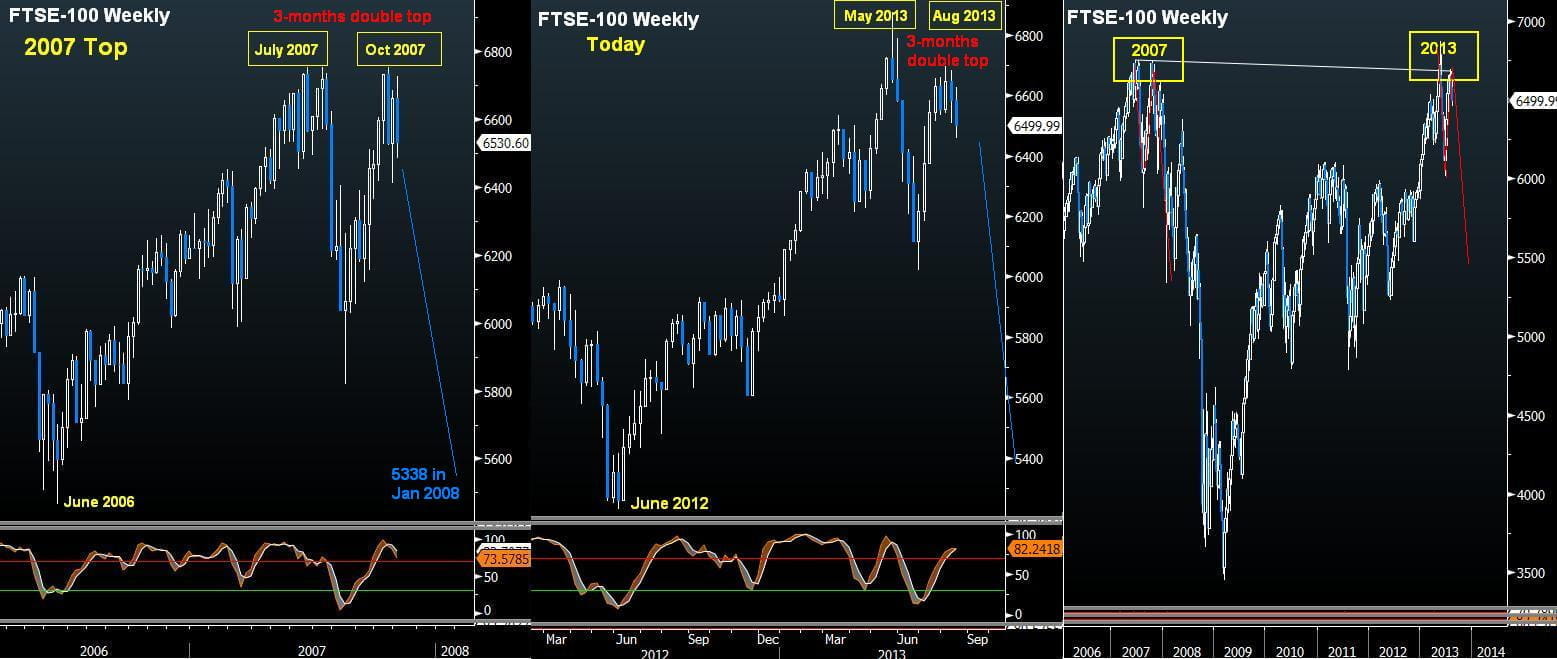
The latest chart patterns from the FTSE-100 may suggest a potential repeat of the double-top formation of 2007, which was followed by a 49% decline. This month’s peak of 6,696 was a failed attempt to retake this year’s high of 6,875. The failure, three months apart, bears signs of the double top from July 2007 and October 2007 (left chart).
Also note, the last major upleg in the FTSE-100 began in June 2012, nearly twelve months before the index hit 13-year highs in May of this year. Similarly, the first of the FTSE-100’s two peaks in 2007 occurred nearly twelve months after the low of June 2006. If this month’s peak does turn into a double-top formation, then we could see a preliminary target of 5,600 from the current 6,500 level. This would be a conservative measure, overlaying the decline from October 2007 to January 2008.
Yield Similarities from 2007 & 2008
The most likely fundamental explanation for the aforementioned decline in the FTSE-100 is the latest 2-year highs in UK gilt yields. Central bankers vocal calls in tempering the latest backup in yields could signify the distrust from policymakers in their own green shoots. The counter to that argument is that true economic recoveries have always withstood rising bond yields in the past. But rarely did Greenspan or Trichet aimed to talk down the work of bond vigilantes. Today’s signs of growth are apparent, but far below the levels needed to reflect “escape velocity”. Yet bond traders are pricing the same conclusion: Higher rates in the event of faster decline in unemployment, or higher rates in the event of faster inflation expectations.
Back to technicals– UK 10-year yields have reached their 200-week moving average (2.73%) for the first time since Oct 2008. Another similarity is that 10-year gilt yields had reached a cycle high in July 2007 at 5.56%, 3 months before the FTSE-100’s 2nd failed peak of October 2007 (double top). Instead of suggesting that the FTSE-100 has another 2-3 months to hit a new peak, It is more plausible that the index could have another failed attempt to regain 6,875 before charting a new path downwards.