FTSE 100 rises to a test
First some science. The FTSE 100 index had only a weak 0.0341 inverse correlation coefficient over a year with GBP/USD and a weaker +0.006 coefficient […]
First some science. The FTSE 100 index had only a weak 0.0341 inverse correlation coefficient over a year with GBP/USD and a weaker +0.006 coefficient […]
First some science.
The FTSE 100 index had only a weak 0.0341 inverse correlation coefficient over a year with GBP/USD and a weaker +0.006 coefficient since 11th February.
In fact, the best-known British stock index (which isn’t necessarily tied tightly to the UK economy) was better correlated with EUR/GBP during the same stretch.
But not much.
FTSE-to-EUR/GBP correlation between 17th March 2015 and 17th March 2016 was -0.2907 and a better -0.4350 since 11th Feb.
Again, few statisticians would be turned on by that result.
But it was worth looking at these relationships given the index’s advance of as much as 13% from 2016 lows in February.
We might also have considered the impact of a softer dollar since earlier this year which has given commodities and related shares a lift.
It’s now quite the truism that few global stock indices are as heavily weighted in mining and oil shares as the FTSE 100.
But it remains remarkable that the FTSE’s launching point in February went hand-in-hand with a bout of European shuttle diplomacy by UK Prime Minister David Cameron.
His travels culminated in a new deal with the EU announced in Brussels on 18th February.
That agreement, which Cameron claimed gave Britain better terms and ‘special status’, was widely regarded as the start of campaigning for Britain’s referendum on EU membership which will now be held on 23rd June.
The pound subsequently had one of its most remarkable routs for years.
Regardless of the outcome of the vote, perceived uncertainty facing the UK economy in the run-up to ‘Brexit’ risk, destabilised sterling in advance.
Cable’s 5.7% slide during February was followed by an erratic 4.6% climb to date.
The implication of course is that a weaker sterling may have provided a tailwind for a chunk of UK Plc., and that this was reflected in the FTSE 100.
The FTSE had, after all, began outperforming major Japanese, Chinese, US and European counterparts at the start of the year.
Well, now we know that mathematically speaking at least, sterling weakness is not particularly related to the rise of blue-chip shares, except perhaps in the minds of investors.
Certainly, the latest leg of GBP/USD’s comeback—up 4.6% in a fortnight, including +1.6% on the day at the time of writing—has seen FTSE trade sideways.
Thesis and hypothesis aside, from a technical basis, after rising in a near-perfect channel since 11th February, the FTSE has consolidated since 2nd March.
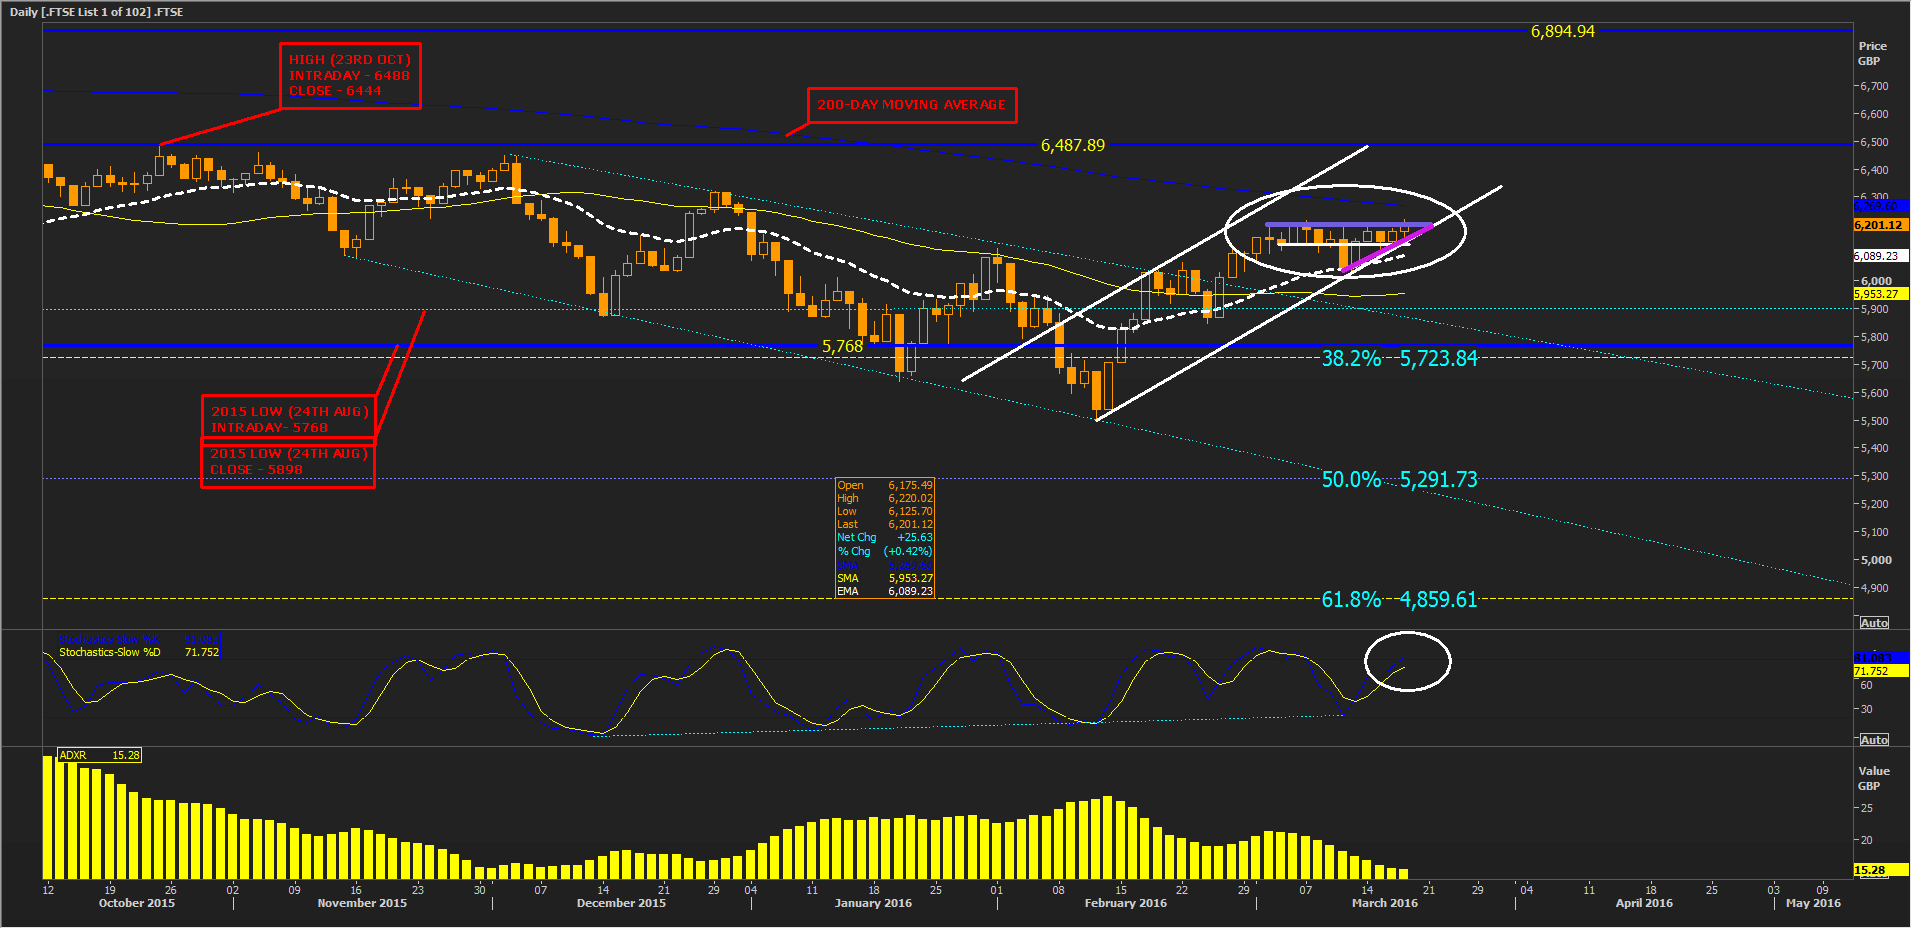
Please click image to enlarge
It formed both a thin flag and an ‘ascending triangle’ to date.
Or just the latter, depending on your tolerance for imperfection: a sharp sell-off broke the flag around its half-way point, though the index eventually slotted back in.
The potentially bullish triangle remains intact.
Proximity to a reality check in the shape of FTSE’s 200-day moving average (DMA), now less than 70 points away, suggests an important juncture looms.
Should resistance that forms the upper line of the triangle mentioned earlier be breached, FTSE 100’s chances of re-taking that 200-DMA ought to be improved.
This would burnish the benchmark’s credentials as a leader even further.
Certainly, action beyond the 200-day would bring the index’s most significant and visible recent failure back into view, highs between 6444-6488 on 23rd October 2015.
However it has to be said that risk of a further failure appears to be more than moderate in the near term, given the less-than-perfect trend.
Moving average lines including the dark blue 200-DMA already mentioned, yellow 50-DMA and white-dotted 21-day exponential MA are classically out of whack.
Backing that up, our ADXR (Average Directional Movement Index Rating) sub-chart (yellow histograms) is giving a 15.28 reading.
That is within the 0-25 ‘absent or weak’ band prescribed by the indicator’s inventor J. Welles Wilder.
Nevertheless, our Slow Stochastic sub-chart suggests momentum is not yet ‘overbought’.
That is a plus point should FTSE look set to rally definitively again in the near term.
Additionally, support drawn in white, circa 6130, 21-day exponential trend, 50-DMA, and a host of further supports, including the top of a descending channel from early December, all stand in the way of a sharper pull-back.
These should prevent a visit to 50% of the index’s ascent from credit crunch nadir at 3460.71 in March 2009, to 2015 record highs.
Regardless of sterling action though, the FTSE 100 will probably need such back-up during the next few months.
