FTSE 100 faces 2nd straight yearly loss as UK shares lose favour
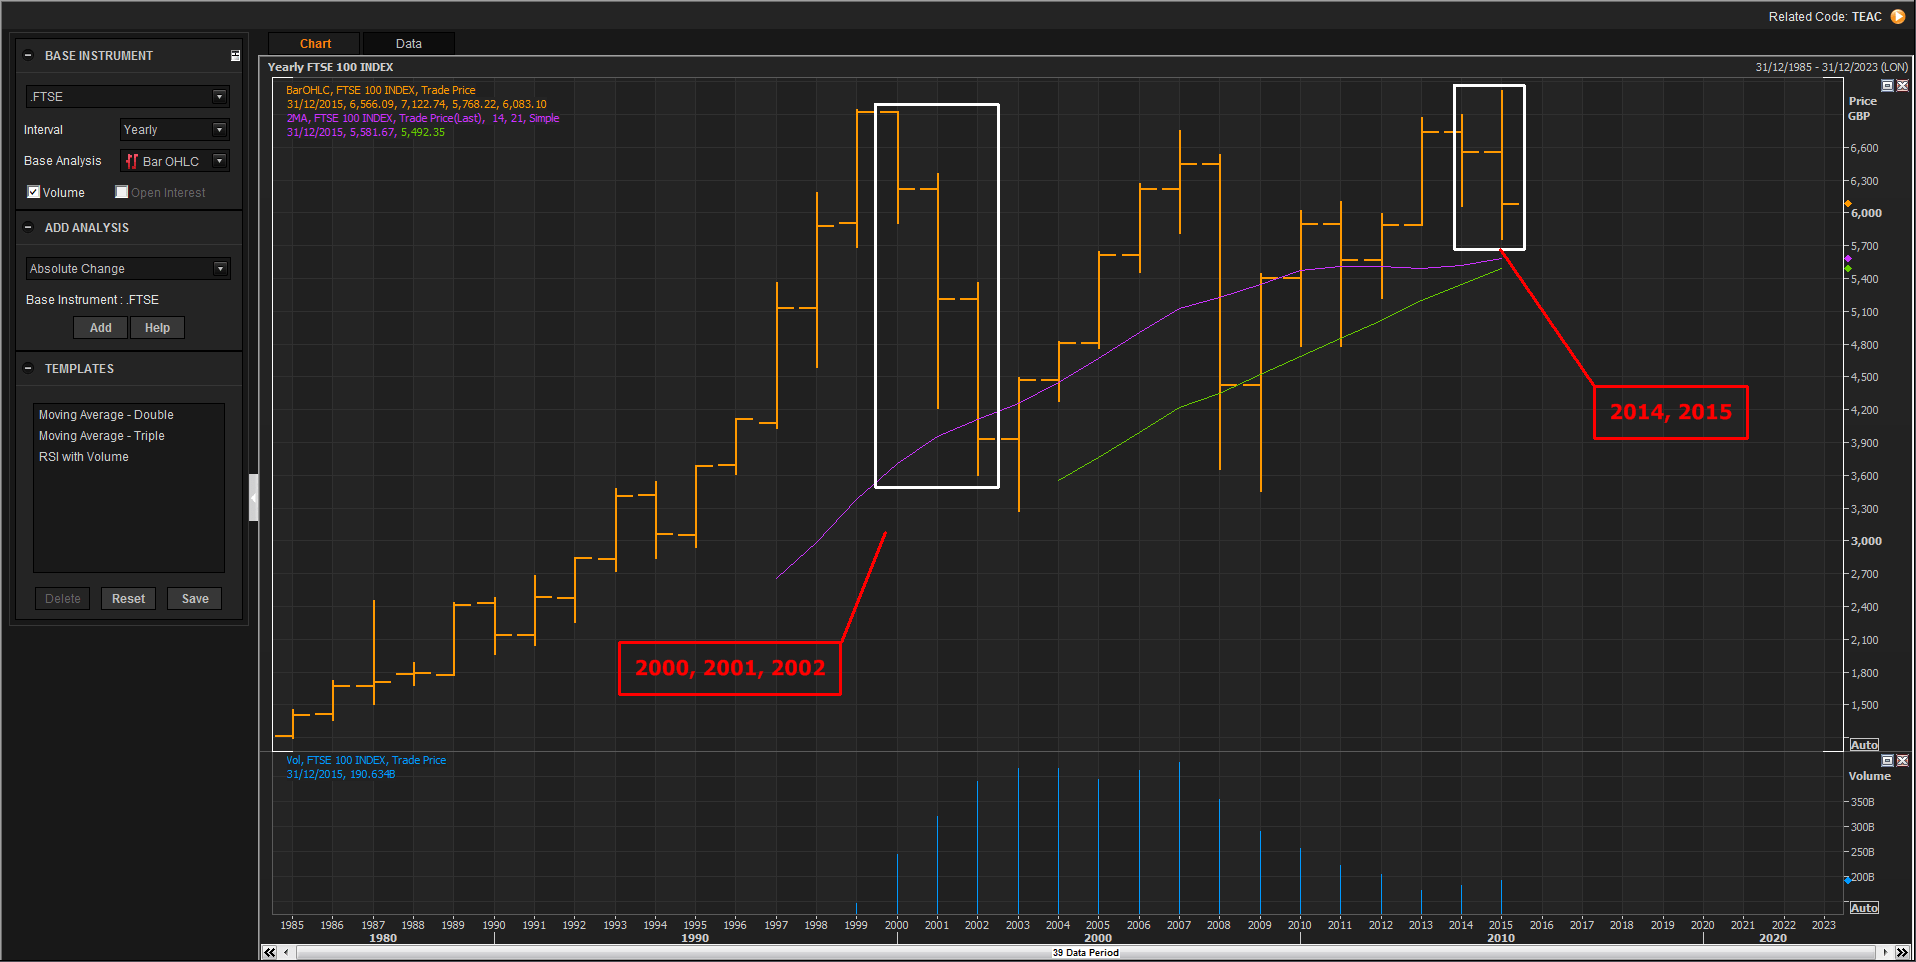
The FTSE 100 looks set to close 2015 with another annual loss, marking only the third year in 30 the index has fallen consecutively. […]
The FTSE 100 looks set to close 2015 with another annual loss, marking only the third year in 30 the index has fallen consecutively. […]
The FTSE 100 looks set to close 2015 with another annual loss, marking only the third year in 30 the index has fallen consecutively.
Please click image to enlarge
Britain’s equities benchmark rebounded strongly in 2009, a year after its ‘credit crunch’ collapse in 2008.
That leaves 2001 and 2002 as the only other two years since 1985 in which the FTSE closed consecutively lower.
As in 2014, the drivers behind underperformance in 2015 are well-known.
The deep sell-off of UK mining and oil shares this year, at least matching the year before, even eclipsed an increase by UK-based investors last month, of global equity holdings compared to bonds and cash.
A poll by Thomson Reuters conducted between 14th and 21st December showed British investors cut net UK equities exposure to 26.6% from 29.5% in November.
By contrast, they raised holdings of Japanese shares to the highest level seen since Reuters began conducting the survey.
Other highlights are below.
Big cuts by UK investment managers in local shares also contrasted with their US counterparts.
Another two or three more Federal Reserve interest rate rises, after the first since 2006 last week, are now widely expected.
But risks from these combined with falling earnings expectations have mostly been shrugged off by US large investors.
A separate Reuters survey in late November showed US fund managers kept recommendations for equity holdings steady for a third month.
Global equity allocations accounted for 51.4% of the month’s US aggregate portfolio, barely changed from 51.3% in September and October.
It was lower than levels above 66% from early in 2010 though.
‘Safer’ US bond allocations were also creeping higher.
However, the “gradual” pathway for US rates laid out by the Fed last week still meant further repatriation of monies back to the US in favour of North American assets was not far-fetched.
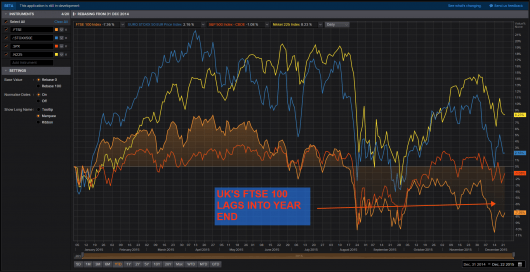
All this leaves the UK among the few developed regions in which global investment managers reported significant recent reductions.
That’s certainly in keeping with the UK stock market having underperformed Japanese, European and US counterparts in 2015.
Please click image to enlarge
As mentioned, the underperformance was partly due to UK indices’ heavy weighting of miners and emerging market-focused companies, which have been battered by low commodity prices.
Additionally, whilst the UK economy has outperformed Europe and most of Asia this year, investors may also be minded that the size of the UK’s current account deficit is unprecedented in peacetime.
The risk of extreme consequences remains moderate, but a correction could cause a dramatic depreciation in sterling.
Markets might welcome the implied boost to imports, but not medium-term market disruption
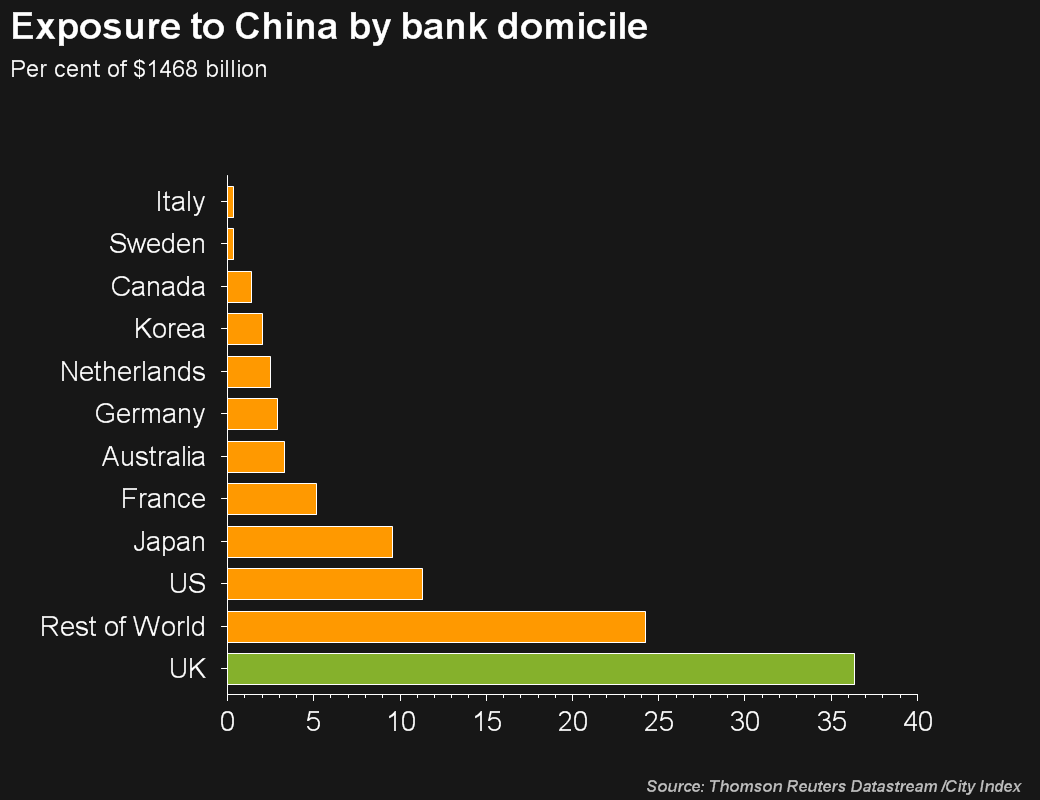
UK trade headwinds also include its financial services sector, with a truncated emerging markets slowdown in view.
Since Britain’s EM exports are no higher than 25% of its total, the biggest risk is for large UK-listed banks.
They have more business in China alone, than lenders based in any other global region.
Please click image to enlarge
Back in Europe, if the current UK government meets its goal, 2016 will also bring an ‘in/out’ referendum on EU membership.
Regardless of the moderate long-term economic and investment risk this represents, periods of market uncertainty before and after the vote are likely.
Finally, and also important for regional equity allocation decisions, is the still considerable likelihood of a first UK rate rise in over 8 years in 2016.
After all, UK growth has managed (just) to stay on trend at circa 2.4%, weaker than 2014’s rate, but respectable.
The Bank of England will also find it difficult to argue against the following factors.
Regardless of the US’s smooth ‘lift-off’, the States and the UK, if it follows suit, will still be the only G7 regions tightening policy whilst others (and most of the world) loosens.
That implies a negative mark in overall reckoning on where to allocate equity capital next year.
This article will be updated with a review of the biggest UK stock losers in 2015, and our take on likely winners in 2016.
