FTSE 100 brakes fail as US hits 8216 circuit breaker 8217
China’s stock market has now crashed so deeply, it has wiped out all gains of the year. It follows its biggest one-day percentage loss since […]
China’s stock market has now crashed so deeply, it has wiped out all gains of the year. It follows its biggest one-day percentage loss since […]
China’s stock market has now crashed so deeply, it has wiped out all gains of the year.
It follows its biggest one-day percentage loss since the height of the global financial crisis in 2007.
During this period, rightly or wrongly, China has become the de facto fulcrum of global market direction.
Hence the world’s stock markets thundered lower in like fashion on Monday, and were on course for declines that were just as painful as China’s.
That’s despite a small but vocal cohort of investors who have begun to query the rationale for Western markets to be as sharply sold off as those in Asia and emerging markets—especially in view of reasonably strong recent earnings seasons on both sides of the Atlantic.
The fact that all major stock markets have drilled deeply into oversold territory, as we pointed out on Friday, isn’t enough to tempt buyers back either.
On that basis, since it looks like markets are in one of their phases of being in the grip of ‘animal spirits’ and are impervious to reason, there is good reason to expect the sell-off in Europe to continue.
Additionally, relief for China’s main market—when it finally bounces ought to trigger the same in Europe’s and perhaps North America’s too.
In keeping with this view on Monday, City Index clients trading the FTSE 100 have experienced great difficulty, if their view was that technical factors were likely to precede a bounce.
This has not definitively occurred.
The blue-chip FTSE 100 index fell as deeply as 6.7% earlier to 5768.22, its lowest level since late 2012.
The index was heading for its worst one-day fall since September 2011.
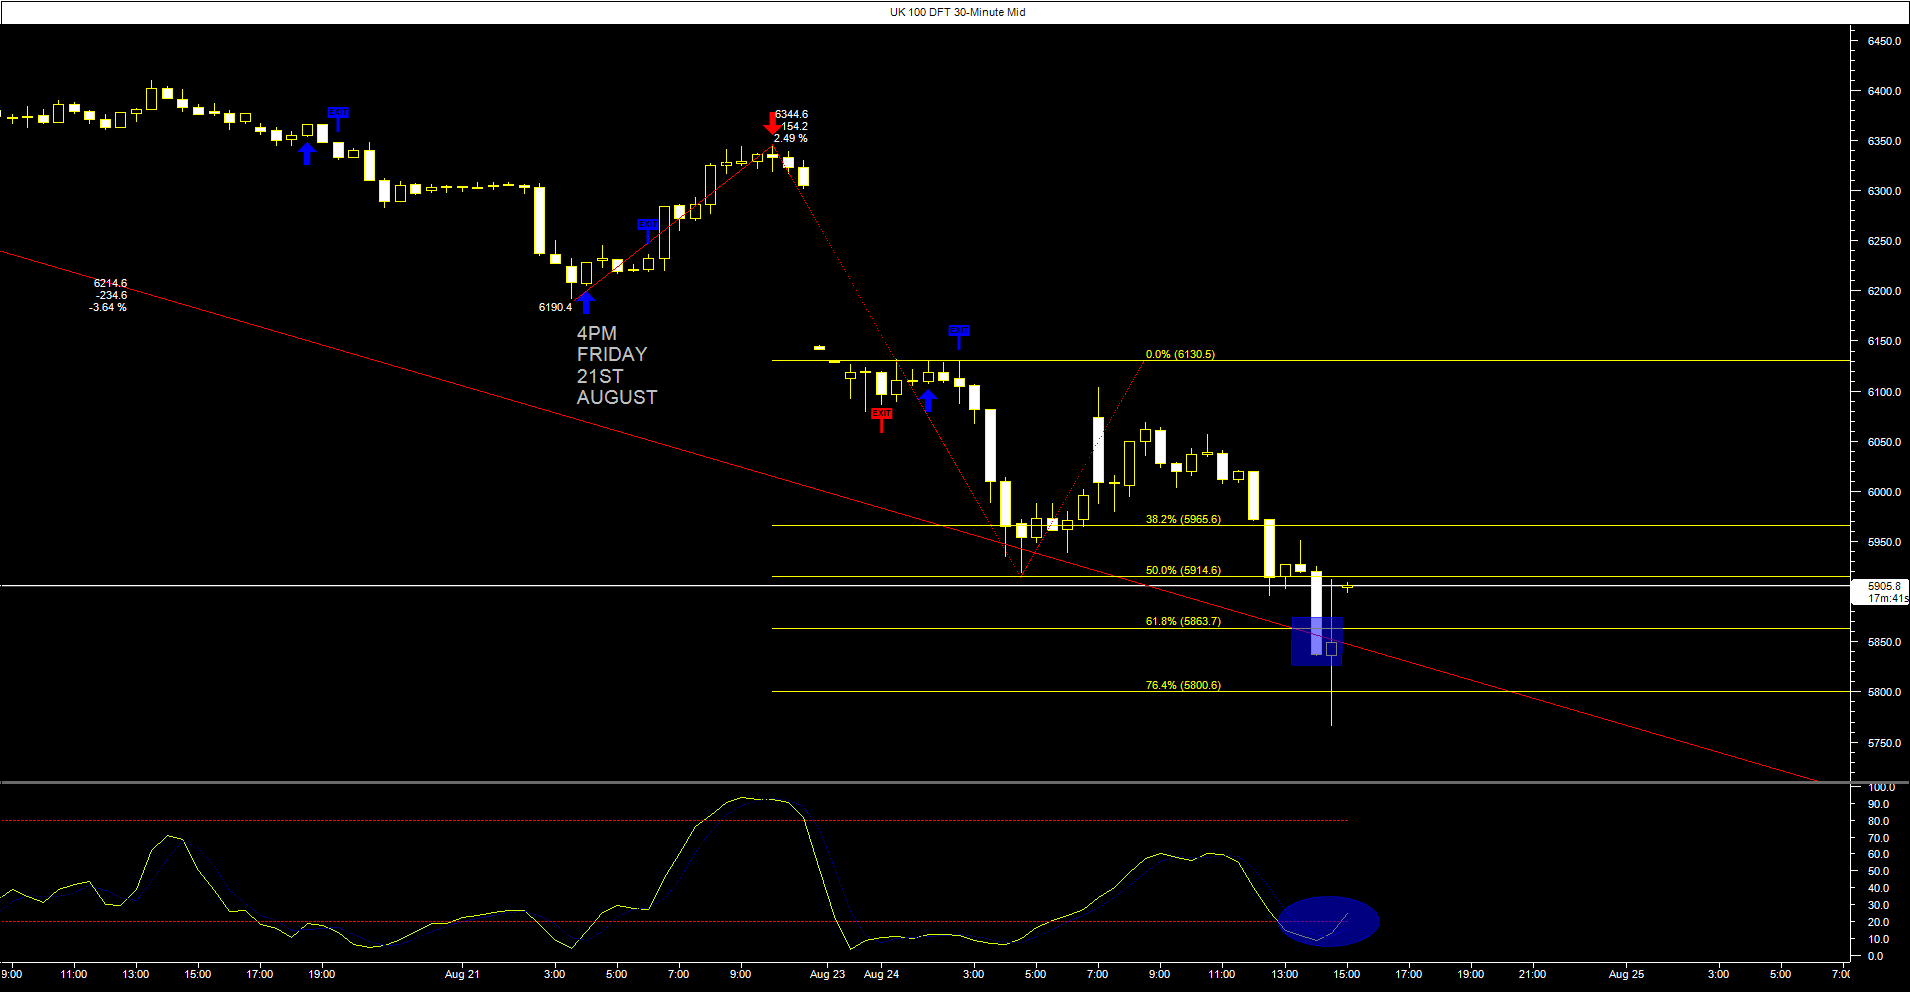
Instead the trade has been making new lows throughout the session on a short-term view (half-hourly intervals were used in the chart below).
The UK100 has pierced a descending line from 19th August (blue square).
In the moments before this article went online, S&P 500 index futures and Dow Jones futures were temporarily halted after both assets shattered the so-called ‘circuit breaker’ set by the exchange.
In reaction the cash markets accelerated even faster downwards, with the Dow in particular burning 1000 points lower.
Having said that, the UK100 also put in its most concerted effort of the day so far to bounce, a short while ago.
It came with the aid of implied support from a 76.4% retracement and a confirmed stochastic Crossover. (The indicator’s blue line has traversed above its yellow line whilst both are beyond the overbought boundary.)
The indicator pictured is part of the Slow Stochastic Reversal Cross System, which signals trades by adhering to stochastic principles closely.
However, note that the last best effort this market attempted to arrest its current declining trend on Friday afternoon (see annotation) failed, with retracement of just 2.5%–not enough to take the index back into the black for the day.
Please click image to enlarge
