FTSE 100 at 14 Year Highs What 8217 s Next
As the FTSE-100 hit its highest close since September 1999 at 6755.63, the percentage of FTSE-100 shares standing above their 200-DMA rises to 84%. Notable […]
As the FTSE-100 hit its highest close since September 1999 at 6755.63, the percentage of FTSE-100 shares standing above their 200-DMA rises to 84%. Notable […]
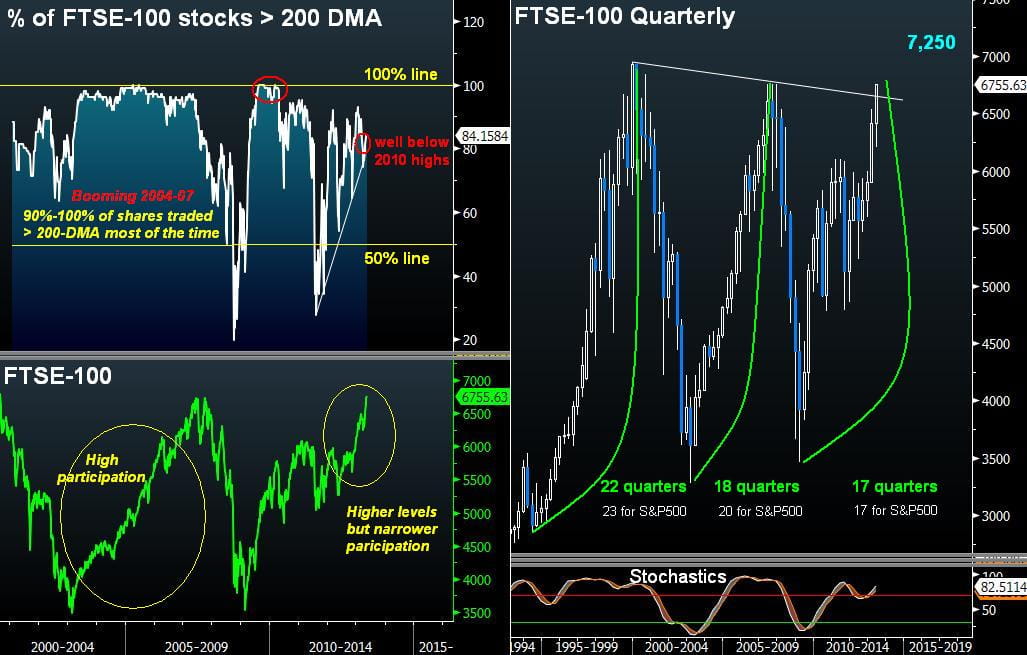
As the FTSE-100 hit its highest close since September 1999 at 6755.63, the percentage of FTSE-100 shares standing above their 200-DMA rises to 84%. Notable gainers leading the recent momentum surge are financials and technology. In our April 29th piece, we noted that 79% of FTSE-100 shares traded above their 200-day moving average. As lofty as that sounded then, we concluded that more upside remained.
An 84% participation remains modest by historical measures as it is the highest since March when it stood at 89%. The highest participation of this year was 94% seen in January. The indicator (200-DMA participation) sheds light on any unfolding divergence between the price of the index and the number of individual components. And so as the 200-DMA participation remains below the year’s highs at a time when the index has gained in momentum, it indicates the 8% rally from the April lows to have emerged on broader participation of shares trading above their 200-DMA. Even more importantly, it may imply more upside for the participation rate as it could possibly mean more advances for the overall index.
51 weeks vs 56 weeks without a 10% decline
It’s been 51 weeks since the FTSE100 hasn’t had a peak-to-trough decline of greater than 10%. This compares to prior rallies of 44 weeks (March 2009 to January 2010), 56 weeks (May 2006 to June 2007),162 weeks (March 2003 to April 2006) and 146 weeks (December 1994 to October 1997)–each without a 10% decline. Duration aside, the ascent of the latest phase has extended by 29%, which is three times less than the last major rally elapsing between March 2009 and January 2010. While the slower momentum compares to previous rallies, the gradual increase in the participation of shares above their long term moving average, suggests that slower rallies may carry less danger of violent declines than do parabolic rallies.
Sectoral Leadership in Technology & Financials
Year-to-date, the top 5 sectors in the FTSE-100 have been: technology (+29.7%); telecoms (26.2%); healthcare (+21.5%); industrials (+20.9%) and; consumer discretionary (19.0%). Materials industry is the only group in negative return at -12.7% year-to-date, followed by energy at +8.6%. The sectoral leadership showed little change among the top three since our last analysis in April 29th, with tech, telecoms and healthcare changing positions at the top 3.
But the 10 percentage-point jump in technology from +18% in the period ending in April 29, to +29.7% in the period ending May 20 is worthy of mention. Information technology– a sector consisting of only 2 companies; ARM Holdings and Sage Group, each of which rose 10% and 9% respectively since April 30th.
Financials were the other notable gainer over the last 3 weeks as the sector rallied to +19% YTD period from +6% in the period ending April 29th. These were led by Hargreaves Lansdown (HL), Schroders (SDR), Prudential (PRU), London Stock Exchange (LSE) and Aberdeen Asset Management (ADN), up 40%, 33%, 23%, 21% and 20% respectively.
Industrial group returns in the FTSE-100 have fared similar to those in the S&P500 in the case of healthcare, consumer staples and technology in the lead, while materials lagged at the bottom of the list.
As the FTSE-100 enters its 12th monthly consecutive rally, the index attains its longest monthly gain for data going back as far as 1984. Today’s 14-year highs at 6,755 accompanied by a growing, yet historically lower participation rate, may suggest that the rally is running out of steam, but could also reduce the likelihood of a violent decline. With the Bank of England maintaining monthly asset purchases at a rate of £375 bn for 11 consecutive months, this is the longest uninterrupted streak of asset purchases since the 22-months ending autumn 2011. The BoE has no choice but to lean towards further monetary stimulus, while inevitably rethinking its upward-leaning inflation target—the combination of which is yet another round of purchases, paving the road towards 7,250 in Q4 of this year.