FTSE 100 8242 s Internal Strength
The FTSE-100 is set to post its 11-monthly gain, beating the previous record of 10-straight monthly advances set in 1996-1997. 79% of shares in the […]
The FTSE-100 is set to post its 11-monthly gain, beating the previous record of 10-straight monthly advances set in 1996-1997. 79% of shares in the […]
The FTSE-100 is set to post its 11-monthly gain, beating the previous record of 10-straight monthly advances set in 1996-1997.
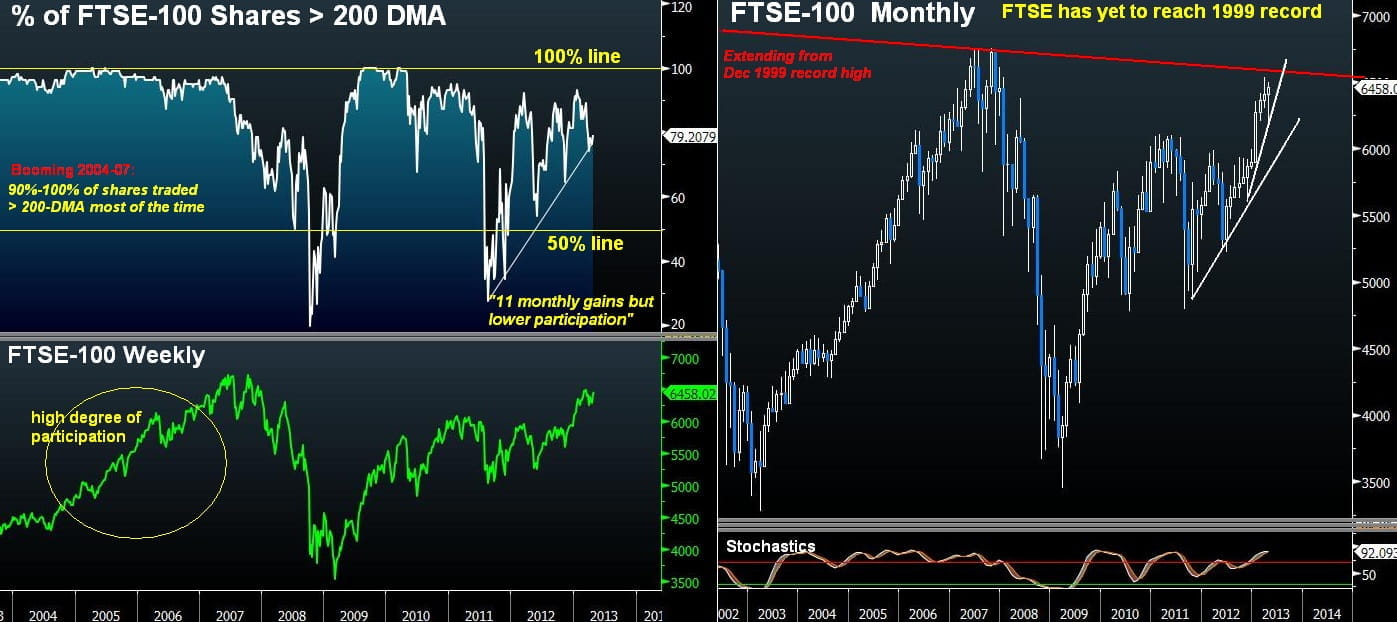
79% of shares in the FTSE-100 are trading above their 200-day moving average. The indicator (200-DMA participation) gives an idea on the internal strength of the underlying index, by highlighting the degree of participation of individual shares in the current rally. Analysing the relationship between the underlying index and the 200-DMA participation sheds light on any unfolding divergence between the price of the index and the number of individual components. That is especially the case if the breadth line stands near or below 50% during a continued increase in the underlying market.
Working in favour of the FTSE-100 is the lack of any divergence between the FTSE-100 and its 200-DMA participation. The latter fell to a 6-month low of 74% in early April at the same time as the index hit a 5-month low. Also note the participation line continues to respect its trendline support since August 2011. Only a close below 75% would be considered a break of the 18-month trendline support.
One reason the FTSE-100’s 200-DMA participation of 79% stands below the 86% seen in the Dow-30 and the S&P500 is the damage sustained to the eight mining shares of the FTSE following the broad damage in gold and iron ore. A renewed decline in commodities would have to be offset by a continued rally in banks, brokerages and asset managers.
Focusing on the FTSE-100, hitting 11-monthly gains is not necessarily a reflection of overbought market momentum. Both the weekly and monthly momentum stochastics measures indicate a path of prolonged stability. The trendline resistance, extending from the 1999 record high, remains untested. 6,590 marks the level at which the 14-year year trendline resistance is to be tested. The immediate resistance stands at 6,530, followed by 6,590. The narrow escape from a triple dip recession coupled with the persistent gains in employment may be sufficient to trigger fresh momentum to the current rally. The threat from the periodic May sell-off, will may well be seen as a buying opportunity as long as the 6,240 support survives a weekly close.