First day of the month sees bullish mood for the markets
With September behind us and gains achieved on the indices for the UK and USA the task of maintaining this positive moment will be a […]
With September behind us and gains achieved on the indices for the UK and USA the task of maintaining this positive moment will be a […]
With September behind us and gains achieved on the indices for the UK and USA the task of maintaining this positive moment will be a challenge if the upper resistance levels are not cleared. The FTSE 100 has seen a shift in momentum to the downside but the Dow Jones has held firmly. What is clear is that each down swing has been followed by a rally. Will this current swing follow through? On a short term basis we often see the start of the trading month begin with a bullish tone and then pullback. By the end of this week we should be able to ascertain the intermediate term direction if strength continues to lift the markets higher. See key levels
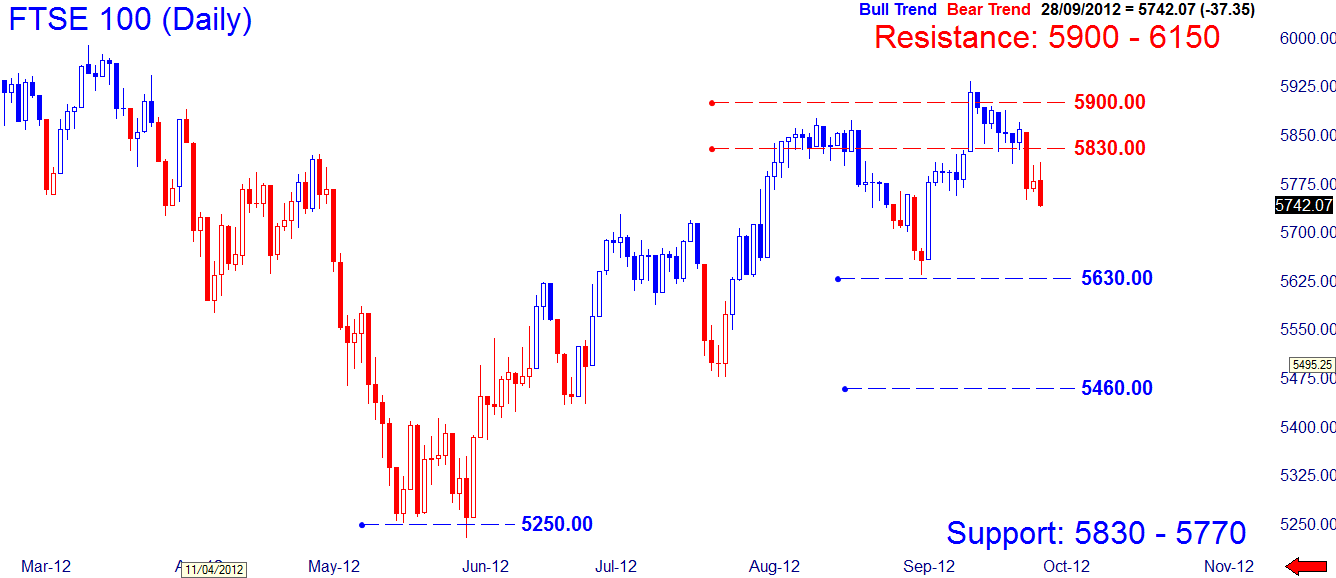
FTSE 100 creates a trend reversal
With a bearish trend taking the index lower last week and creating a trend reversal to the downside, the start of the month has reversed to the upside. But Tuesday will need to see a move above the high of today. If this occurs then the index will be back on track to tackle the 5830 resistance level followed by 5900 again. The higher highs and higher lows argue the case for further upside moves but momentum has weakened and unless a strong thrust takes place the index may create a lower high the close of this week will need to take the index above 5830 to remain bullish.
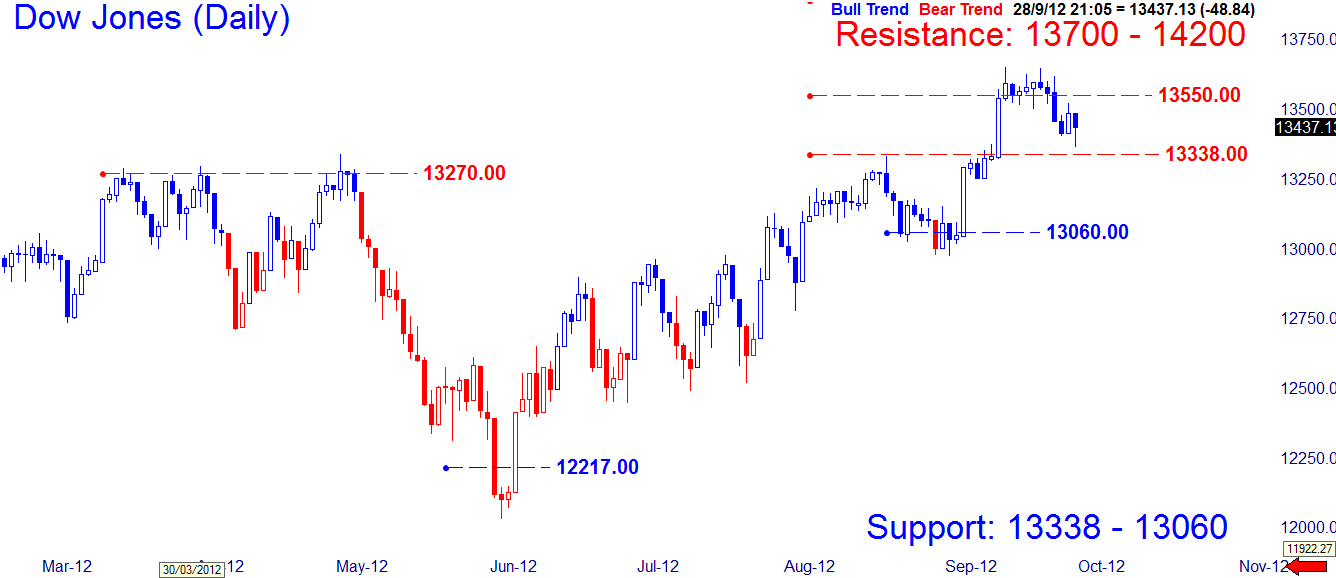
Dow Jones gains +4.9% in September
Clearly a good month for the Dow Jones during September. In order to continue its bullish trend this week, the index will need to try and get above 13500 and remain above this level by the close of Friday. Unlike the FTSE 100 the Dow Jones has not seen a bearish trend reversal and also had a stronger gain for month-ending September. We also see the upwards trend intact so far but a break above the 13653 high is essential to reach for the 13700 level. The worrying aspect is that divergence patterns have remained in place on technical indicators which indicate that the current rally may be reaching exhaustion.
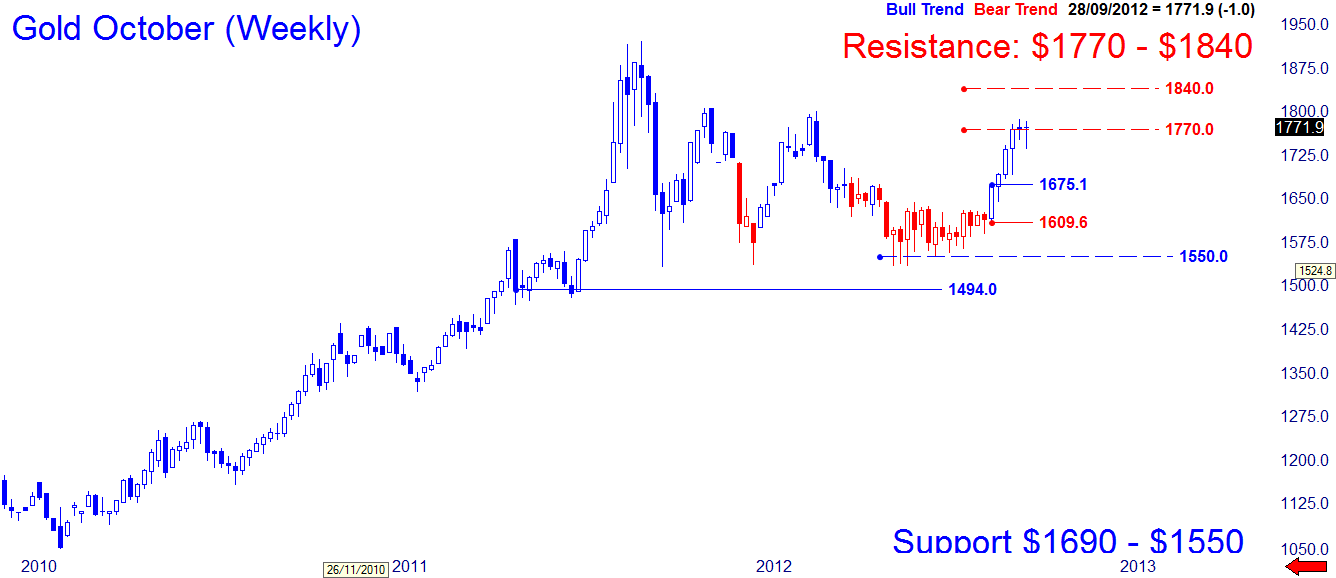
Gold still struggling at $1,770 level
For the last two weeks the price of gold has not seen any real progress. With a trigger to the downside earlier last week the commodity seemed to set the stage for a corrective move. Instead the metal moved upwards but failed to take out the previous weeks high. The chart patterns over the two weeks clearly suggest that it is uncertain if the commodity will sustain the current price level. This would need to get above $1,782 to test $1,840 or else break below $1,735 to see a correction down towards $1,675 but more importantly gold must stay above $1,609 to remain bullish on an intermediate term basis.