


January 27, 2020 11:44 AM
Fight to Safety on Slow Data Day
Germany released its IFO data earlier today, with the headline business climate number coming out worse than at 95.9 vs 97.3 expected. Stock indices around the world are lower today, however its not due to the IFO data, it is due to the fears of the spread of the Coronavirus, as my colleague Matt Weller wrote about earlier today. The flight to safety was obvious, as money moved out of stocks and into safe haven assets, such as Yen.
USD/JPY broke lower out of the rising wedge pattern at the downward sloping long-term trendline dating back to 2015. Today, price gapped lower from 109.25 on Friday down to 108.89 on today’s reopen and is currently putting gin a doji candle to the daily timeframe. Horizontal support and the 200-Day Moving Average come in near 108.50/60. Resistance above at the 109.17 low from Friday.
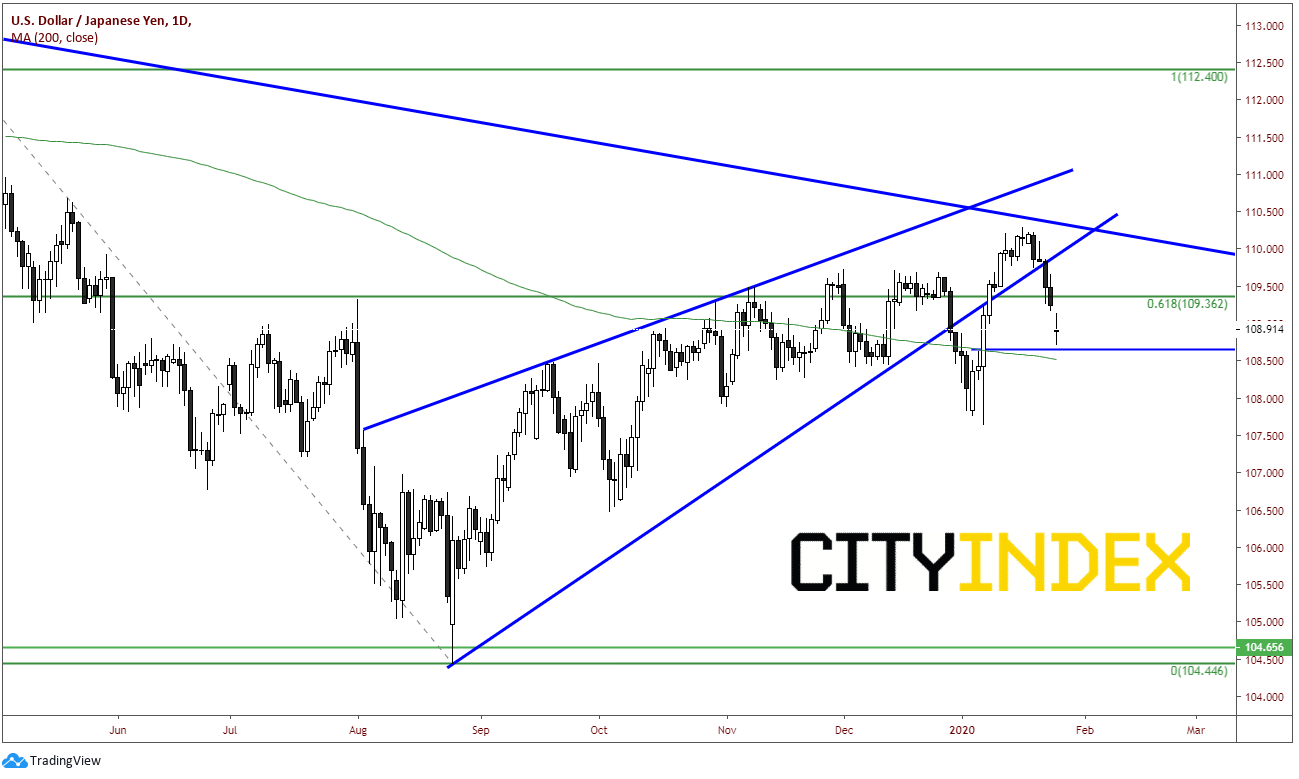
Source: Tradingview, City Index
AUD./JPY and NZD/JPY were hit especially hard on the reopen, as their economies are dependent on China’s economy. China has already extended it Lunar New Year Holiday through next weekend, as officials are urging people to work from home on Thursday and Friday. There is the possibility that the virus can have an effect on GDP, spending is typically high during over the Holiday period.
AUD/JPY gapped lower on the reopen today from a close on Friday at74.96 down to todays open at 74.18. The pair is currently trading on its lows near 73.56. Horizontal support and the 50% retracement level from the low on August 26th to the highs on December 27th comes across at 73.30. The next support level of 72.50 is horizontal support and the 61.8% Fibonacci level of the same time period. Resistance above is at the 200 Day Moving Average and Fridays close near 74.50.
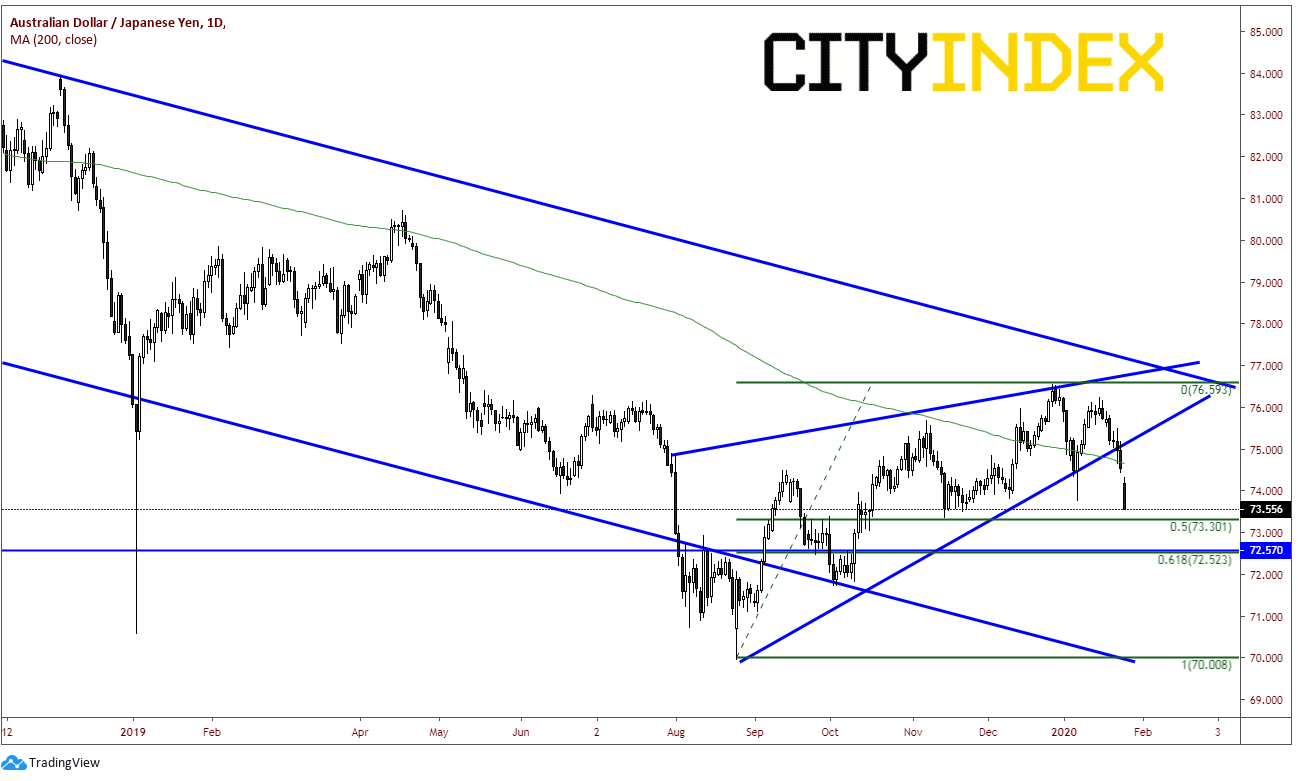
Source: Tradingview, City Index
Similarly, NZD/JPY seems to be putting in a topping formation as well. The pair gapped lower on the reopen from Friday’s close at 72.18 down to 71.61. As with AUD/JPY, NZD/JPY is currently trading on its low near 71.30 with support below at the 28.2% Fibonacci retracement level from the August 26th low to the December 27th high near 70.80. Below that is the 200 Day Moving Average at 70.65 and the 50% retracement level from the same timeframe at 69.94. Resistance above at the gap fill near 72.18.
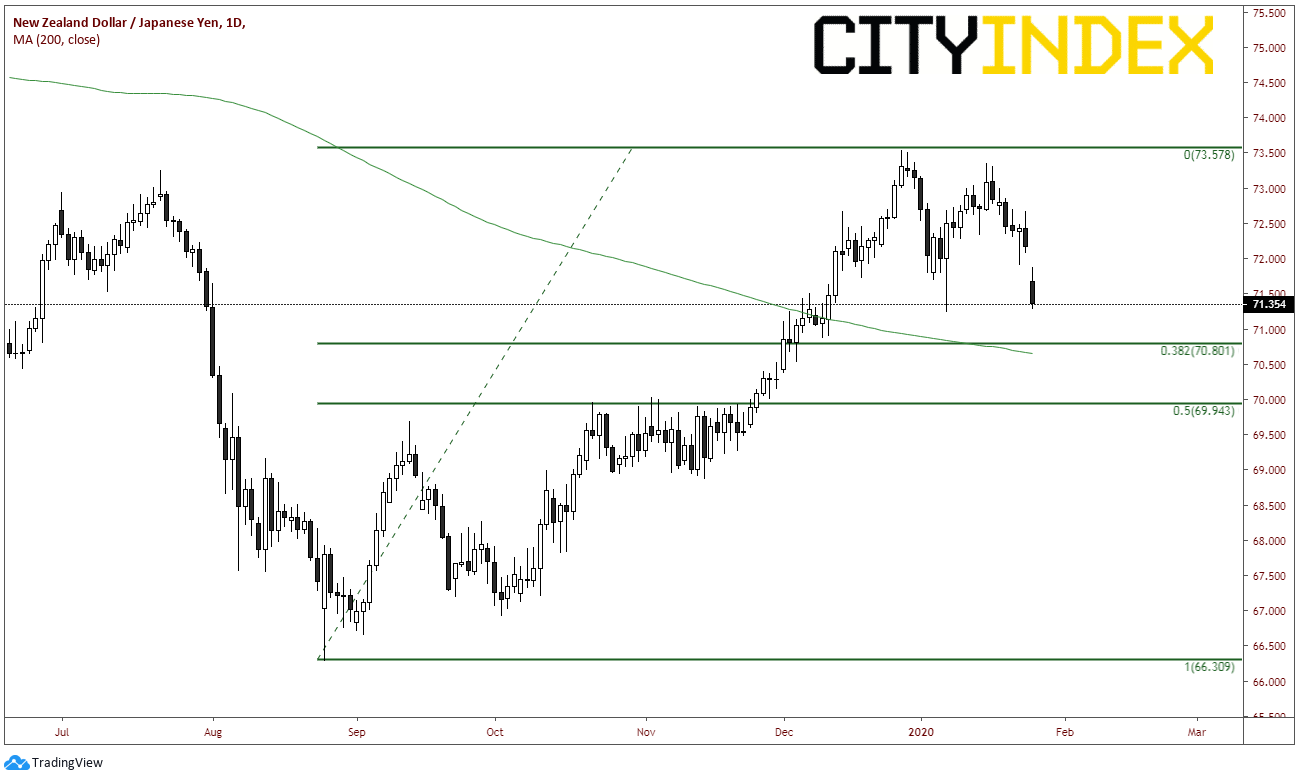
Source: Tradingview, City Index
The next big event this week will be the FOMC meeting on Wednesday. Until then, the focus main focus for the markets will be the headlines from the spread and containment of the Coronavirus. Watch the headlines!
Latest market news
Today 11:14 AM
Today 08:28 AM
Yesterday 03:30 PM
Yesterday 01:23 PM
Latest Dollar articles
April 23, 2024 11:09 PM
April 18, 2024 06:20 AM
February 16, 2024 11:30 AM
February 7, 2024 03:30 PM