


FedEX Corp (FDX)
click to enlarge charts
Key Levels (1 to 3 weeks)
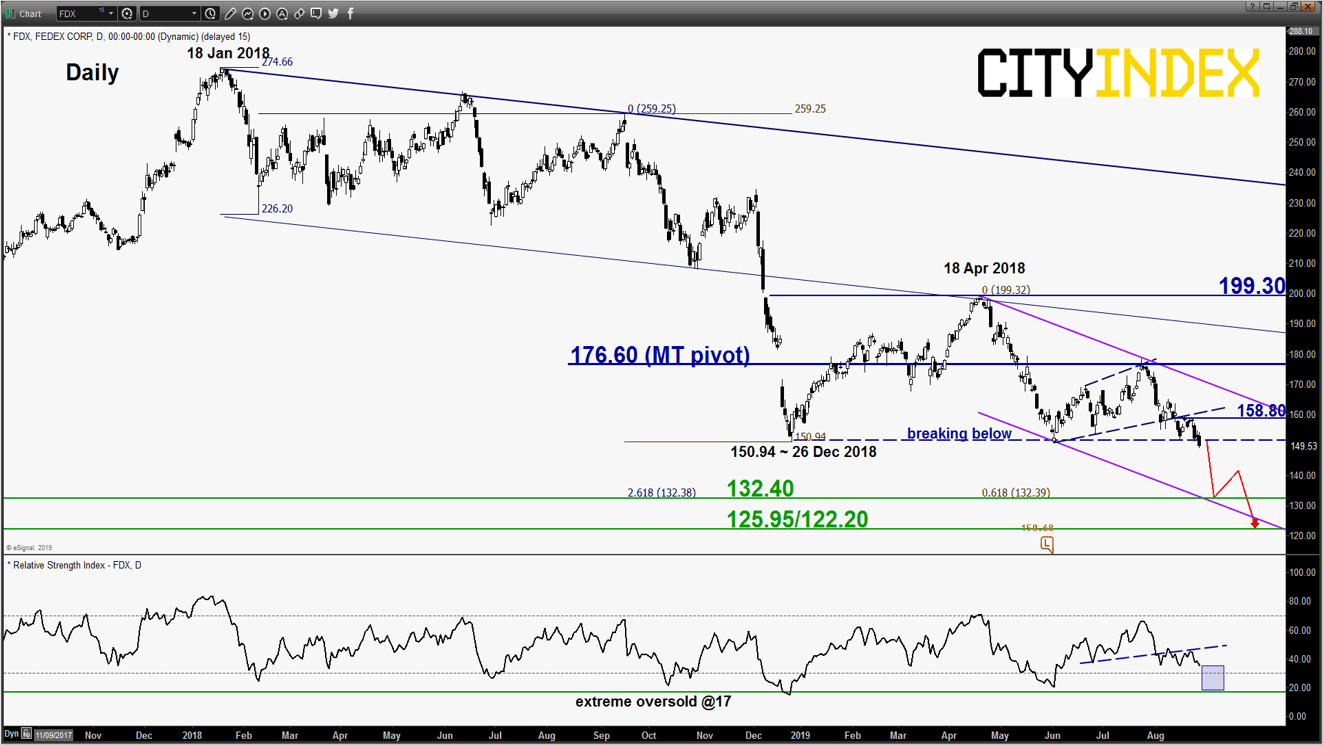
Intermediate resistance: 158.80
Pivot (key resistance): 176.60
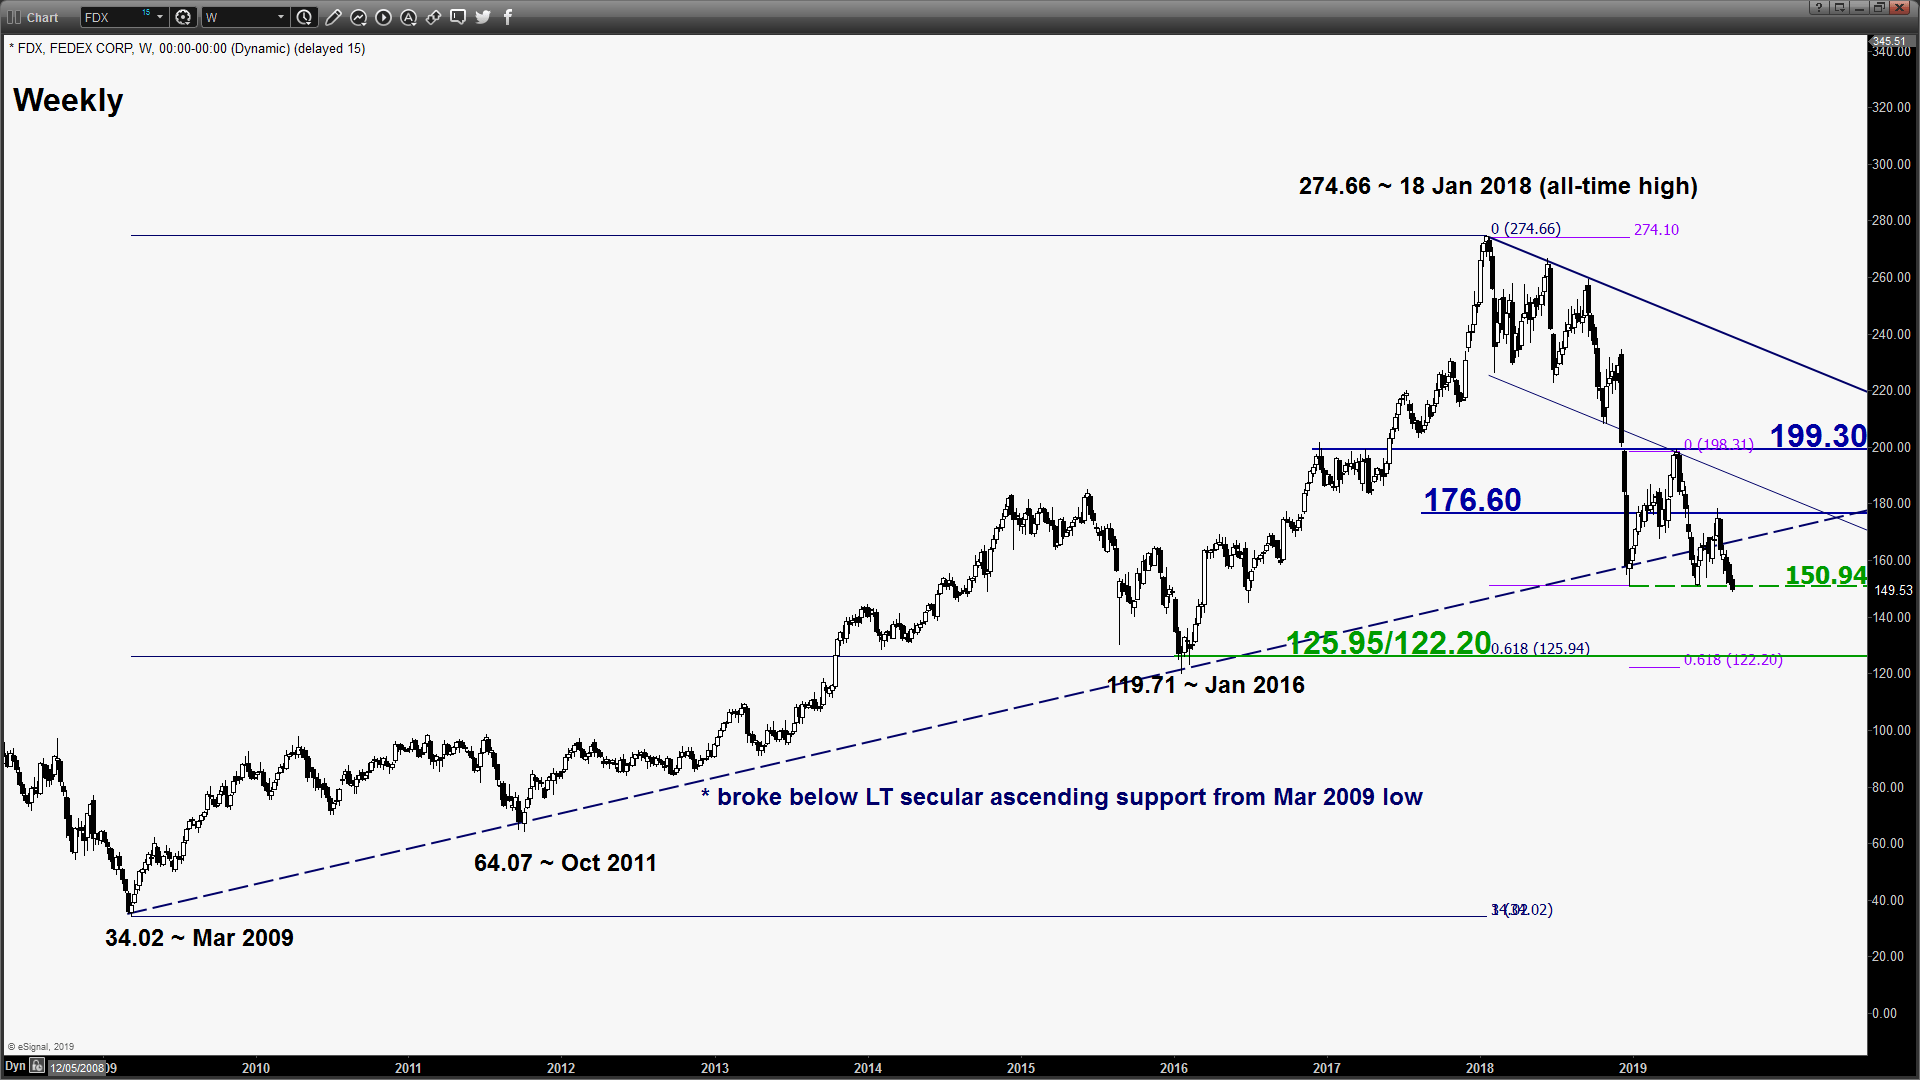
Supports: 132.40 & 125.95/122.20
Next resistance: 199.30
Directional Bias (1 to 3 weeks)
FedEx has staged a bearish breakdown yesterday, 27 Aug below the 26 Dec 2018 low and its 52-week low of 150.68. It has recorded a daily close of 149.53 at end of yesterday U.S. session.
Bearish bias below 176.60 key medium-term pivotal resistance for further potential impulsive downleg sequence to target the next supports at 132.40 and 129.95/122.20 zone. However, a clearance with a daily close above 176.60 invalidates the bearish scenario for a squeeze up towards the major range resistance of 199.30.
Key elements
- After 2-weeks whipsaw in price action seen in early to mid-Jul 2019 above the long-term secular ascending support from Mar 2009 low, FDX has reintegrated below the ascending support and stays below it for the past 4-weeks.
- Since 18 Apr 2018 high, FDX has evolved into a medium-term descending channel with the upper limit acting as a resistance at 176.60.
- The daily RSI oscillator remains negative below the a corresponding resistance at the 45 level which suggests medium-term downside momentum of price action remains intact.
- The next significant medium-term support rests at the 125.95/122.20 zone which is defined by the major swing low of Jan 2016, the lower boundary of the medium-term descending channel and a Fibonacci retracement/projection cluster.
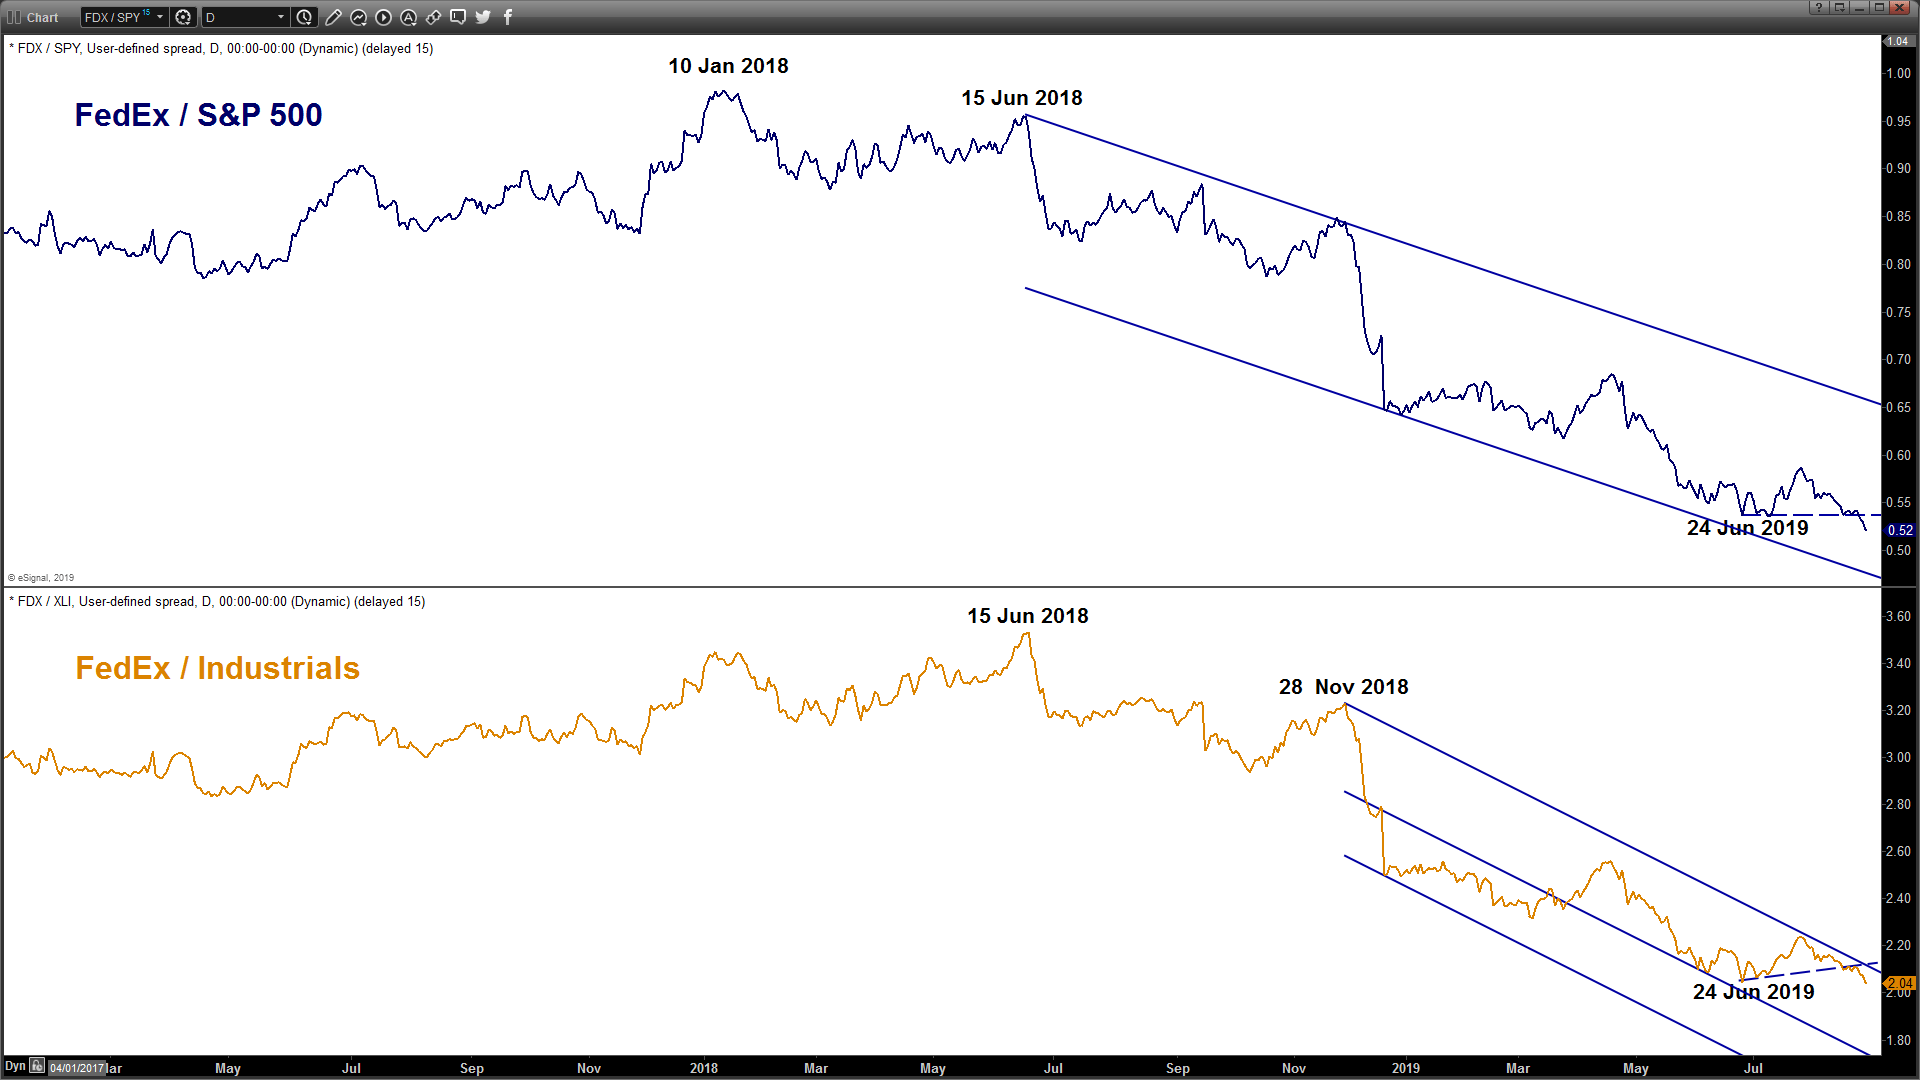
- Relative strength analysis against the market (S&P 500) and its sector (Industrials) are suggesting further potential underperformance of FDX.
Charts are from eSignal
Latest market news
Yesterday 08:33 AM
Latest Shares market articles
November 2, 2023 01:41 PM
November 1, 2023 01:33 PM
October 31, 2023 01:15 PM
October 31, 2023 10:24 AM