


Short-term technical outlook on Hang Seng Index/Hong Kong 50 (Fri 17 May)
click to enlarge charts
Key technical elements
- Despite yesterday’s positive moves seen in the key U.S. benchmark stock indices; the S&P 500 & the Nasdaq rallied by 0.8% to 1%, the Hong Kong 50 Index (proxy for the Hang Seng Index futures) had failed to have a positive follow through in today’s early Asian session.
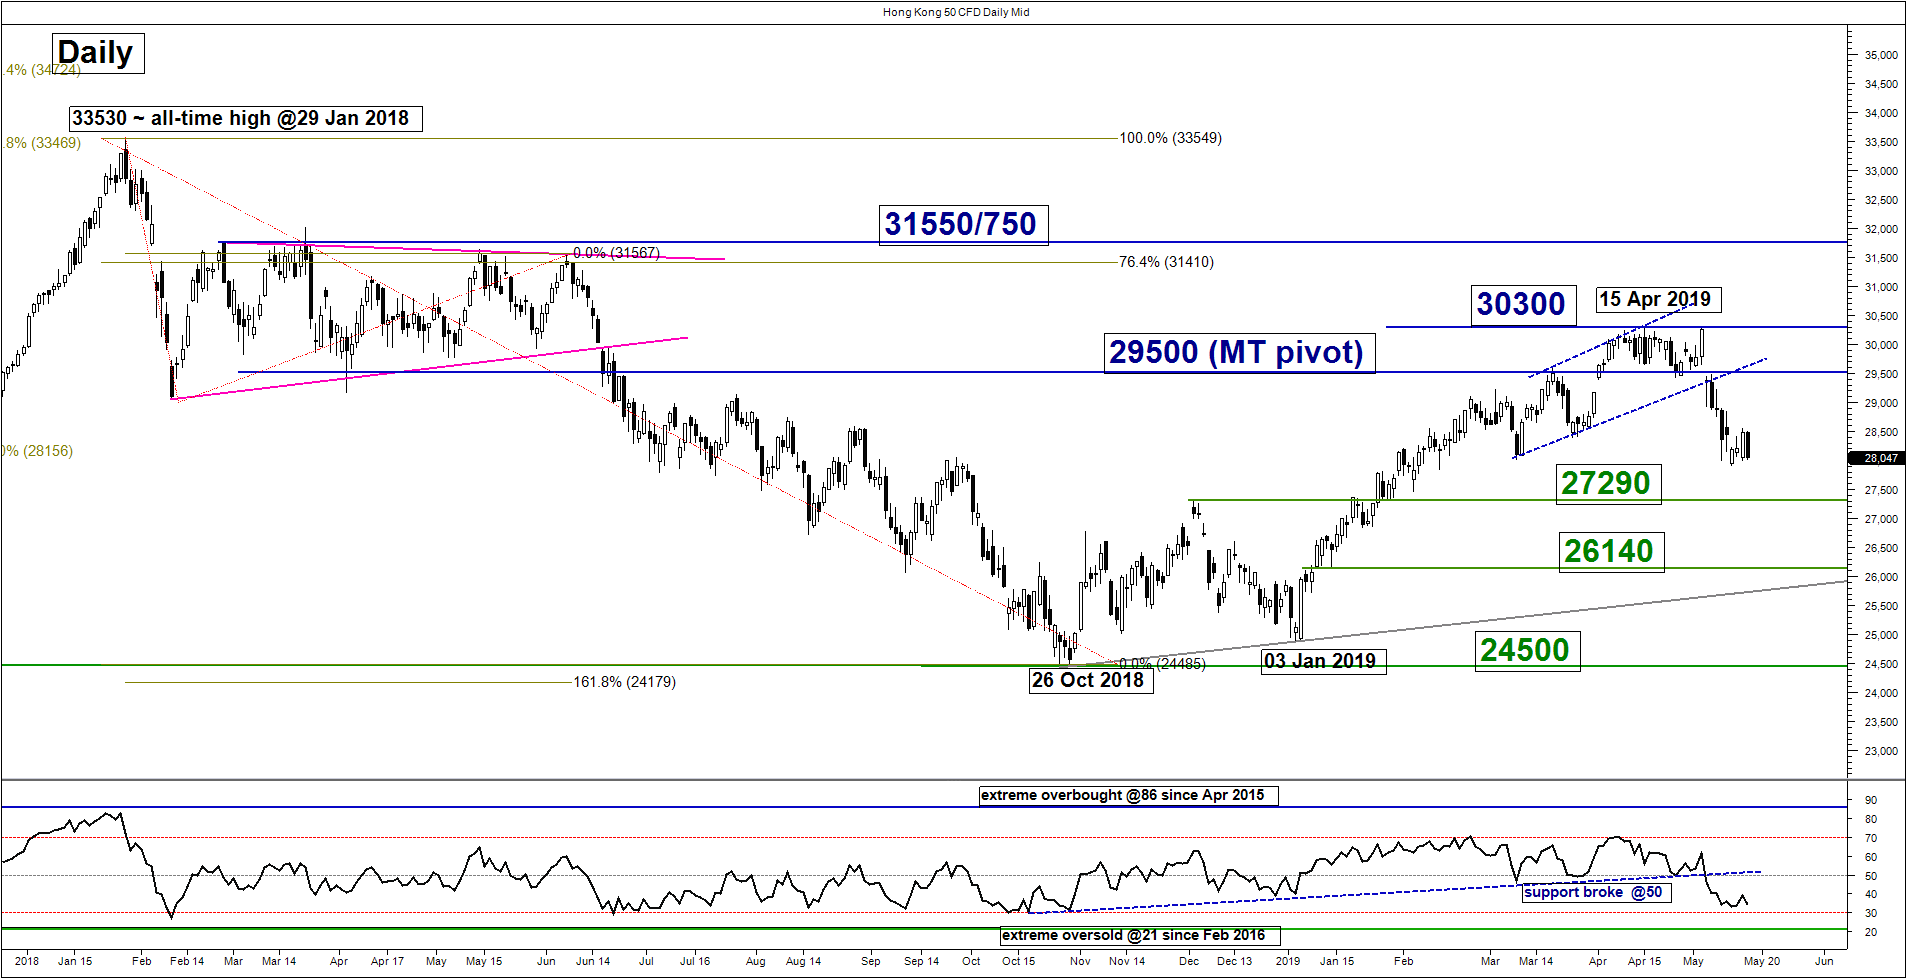
- Its 3-weeks of down move that has started on 03 May 2019 is not showing any clear signs of bearish exhaustion yet as the daily RSI oscillator still has further room to manoeuvre to the downside before it reaches an extreme oversold level of 21. Click here for a recap on the medium-term outlook.
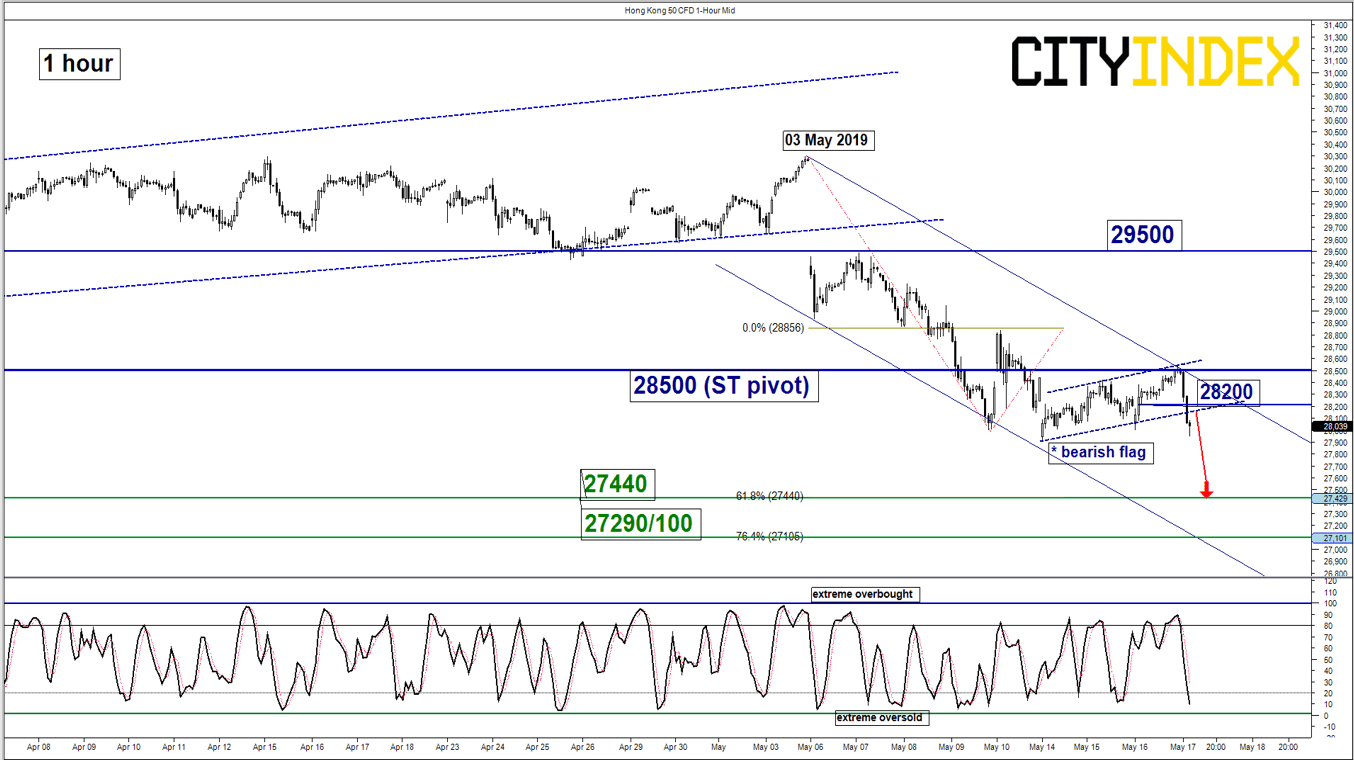
- In the short-term time frame (1-hour chart), the Index has staged a bearish breakdown from a “flag” configuration with intermediate resistance now at 28200.
- The shorter-term hourly Stochastic oscillator has reached its oversold region where the Index may shape a minor bounce at this juncture to retest 28200 before another potential downleg materialises.
- The next significant near-term support rests at 27440 which is defined by Fibonacci retracement/expansion cluster).
- The key short-term pivotal resistance stands at 29500 which is defined by the minor swing high seen in yesterday, 16 May U.S. session and the upper boundary of a minor descending channel from 03 May 2019 high.
Key Levels (1 to 3 days)
Intermediate resistance: 28200
Pivot (key resistance): 28500
Supports: 27440 & 27290/100
Next resistance: 29500 (medium-term pivot)
Conclusion
If the 28500 key short-term pivotal resistance is not surpassed, the Index is likely to shape another potential impulsive downleg to target the next support at 27440.
However, a break with an hourly close above 28500 negates the bearish tone for a continuation of the corrective rebound sequence towards the 29500 key medium-term pivotal resistance
Charts are from City Index Advantage TraderPro
Latest market news
Today 08:15 AM
Today 05:45 AM
Yesterday 11:09 PM