


How About FAANG Stocks?
On Thursday (July 23), U.S. stocks encountered a sell-off, which was led by shares in Technology Hardware & Equipment (-3.26%) and Software & Services (-2.55%) sectors.
While the Dow Jones Industrial Average fell 1.31% and the S&P 500 dropped 1.23%, the tech-heavy Nasdaq 100 slumped 290 points (-2.67%) to 10580, the biggest loss since June 11.
Profit-taking has been seen in tech shares following their recent strong run. Tech giants Tesla (TSLA -5.0%) and Microsoft (MSFT -4.4%) came under pressure after reporting quarterly earnings in late Wednesday.
So, how are the five prominent tech stocks FAANG -- Facebook (FB), Amazon (AMZN), Apple (AAPL), Netflix (NFLX); and Alphabet (GOOG, Google's parent) -- faring at this potential turning point?
Netflix (NFLX) has slumped an accumulative 9.4% since posting downbeat second-quarter earnings last week.
Facebook (FB) will release earnings on July 29 (Wednesday), while Amazon (AMZN), Apple (AAPL) and Alphabet (GOOG) will do so on July 30 (Thursday).
Technical analysis for FAANG stocks are given below.
On a Daily Chart, the Nasdaq 100 Index keeps trading within a Bullish Channel drawn from early April.
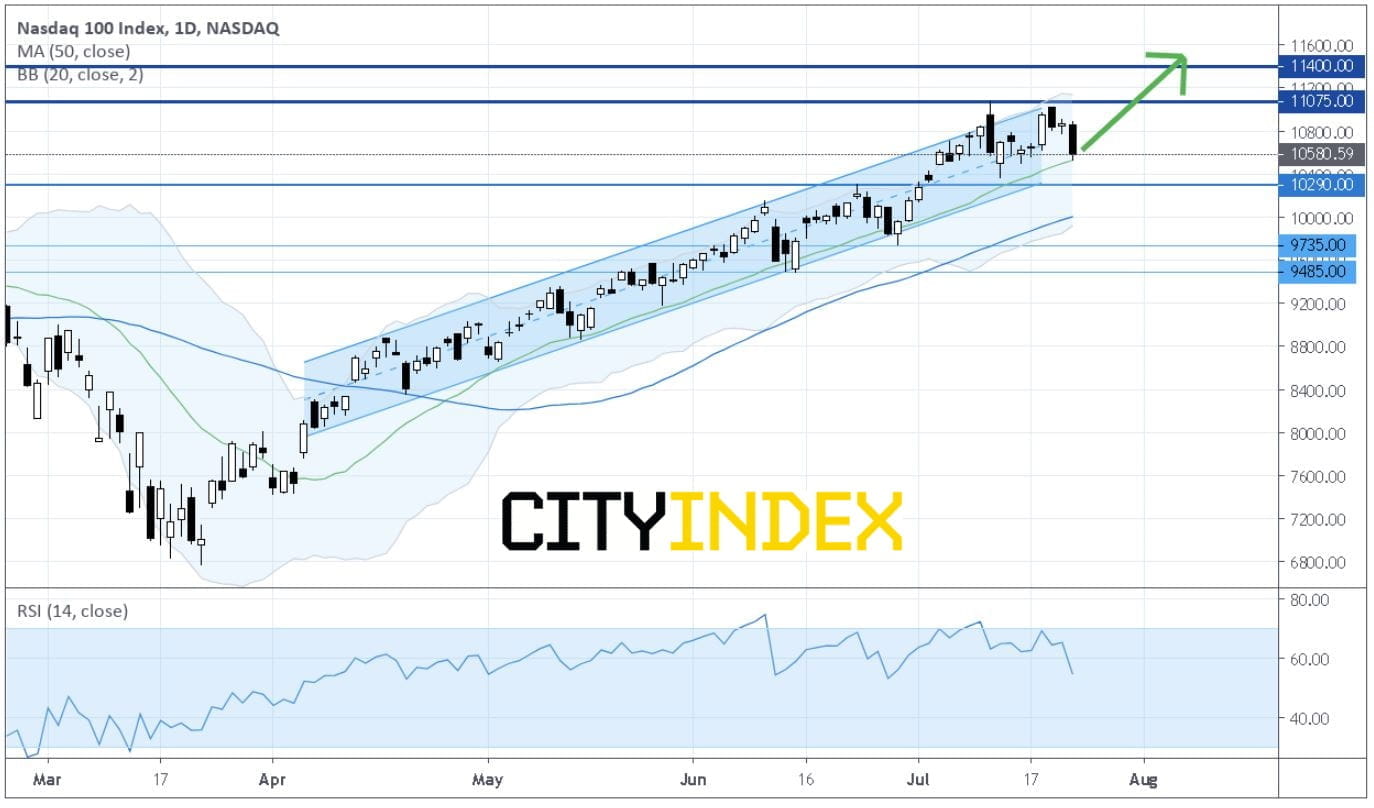
Source: GAIN Capital, TradingView
Overhead resistance is expected at 11075.
However, caution is advised as the relative strength index has shown a Bearish Divergence. A break below 10290 would send the index down to 9735 (the intraday low of June 29).
Facebook (FB) has failed to re-established a Rising Trend Line.
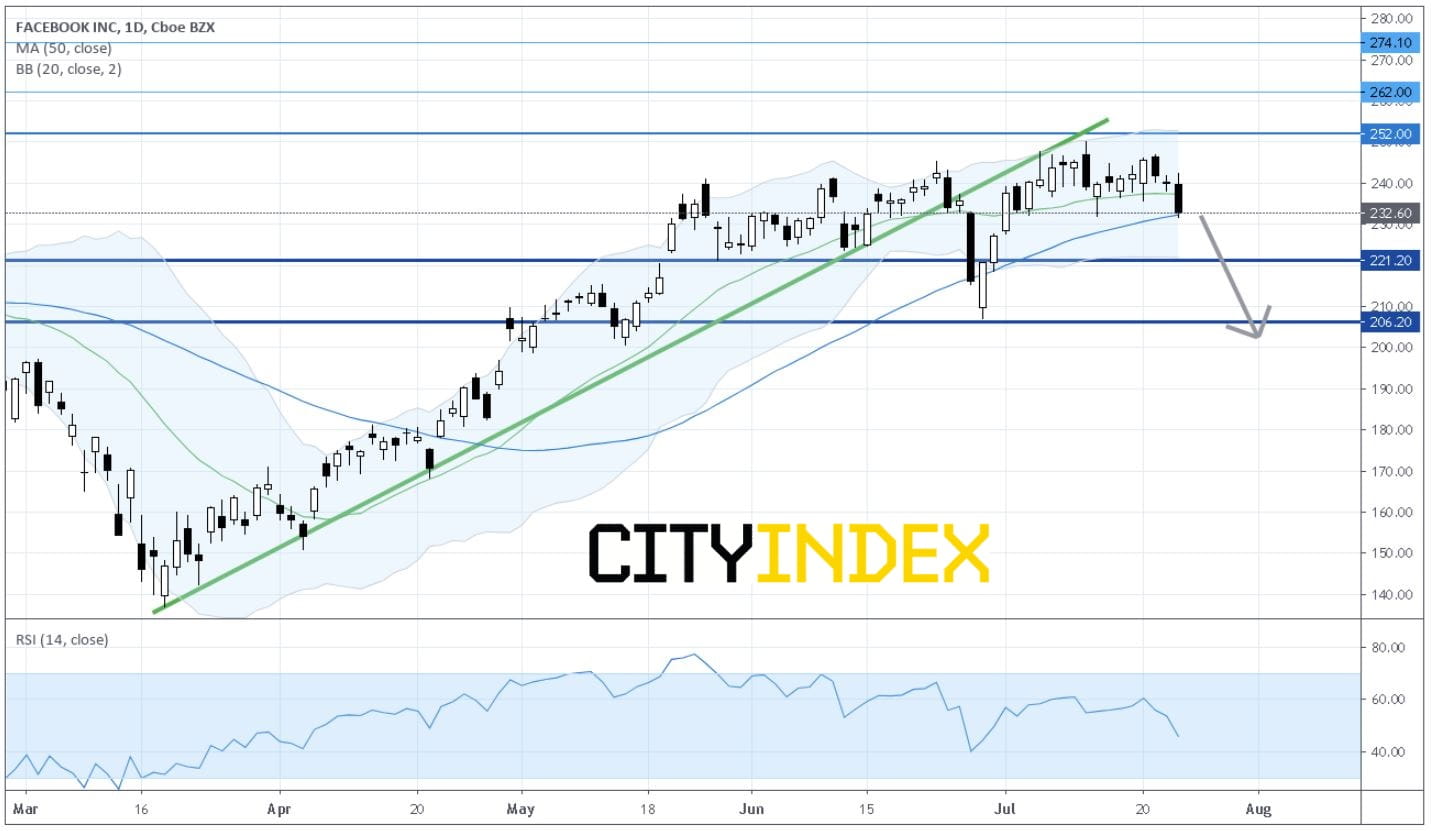
Source: GAIN Capital, TradingView
The stock has returned to levels Below the 20-Day Moving Average.
And the Relative strength Index is badly directed in the 40s, suggesting a lack of upward momentum.
A further pull-back would bring the stock down to $221.20 and $206.20 (the intraday low of June 29).
Only a return to the Key Resistance at $252.00 would bring about a bullish reversal.
Amazon (AMZN) is shaping up a Bearish "Double-Tops" Pattern.
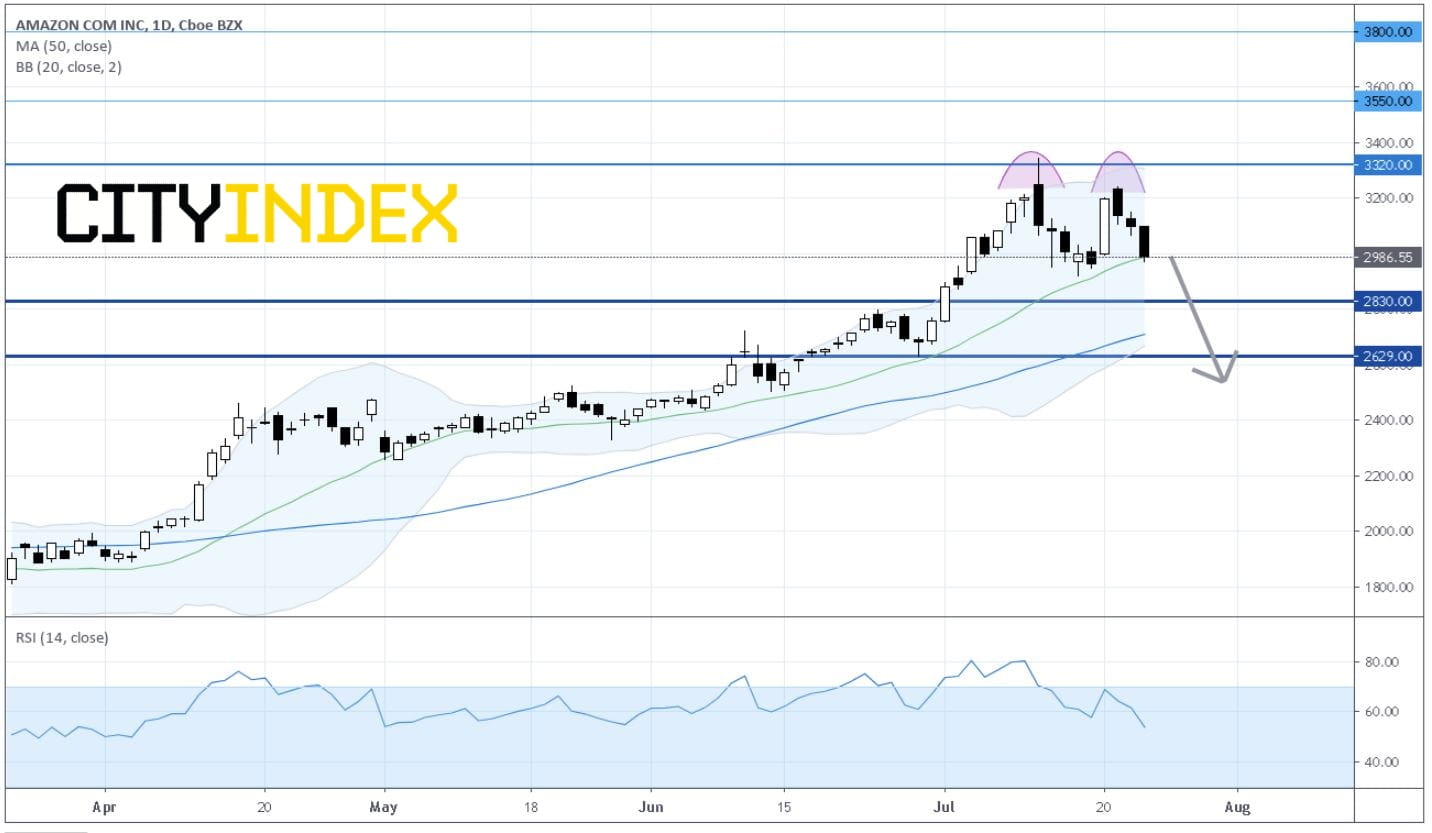
Source: GAIN Capital, TradingView
It has sunk back to levels around the 20-Day Moving Average.
Further Weakness would bring the stock back to $2830 and $2629 (the low of June 29) on the downside.
Key Resistance is located at $3320 (around the intraday high of July 13).
Apple (AAPL) is dropping down from a Bullish Channel drawn from April.
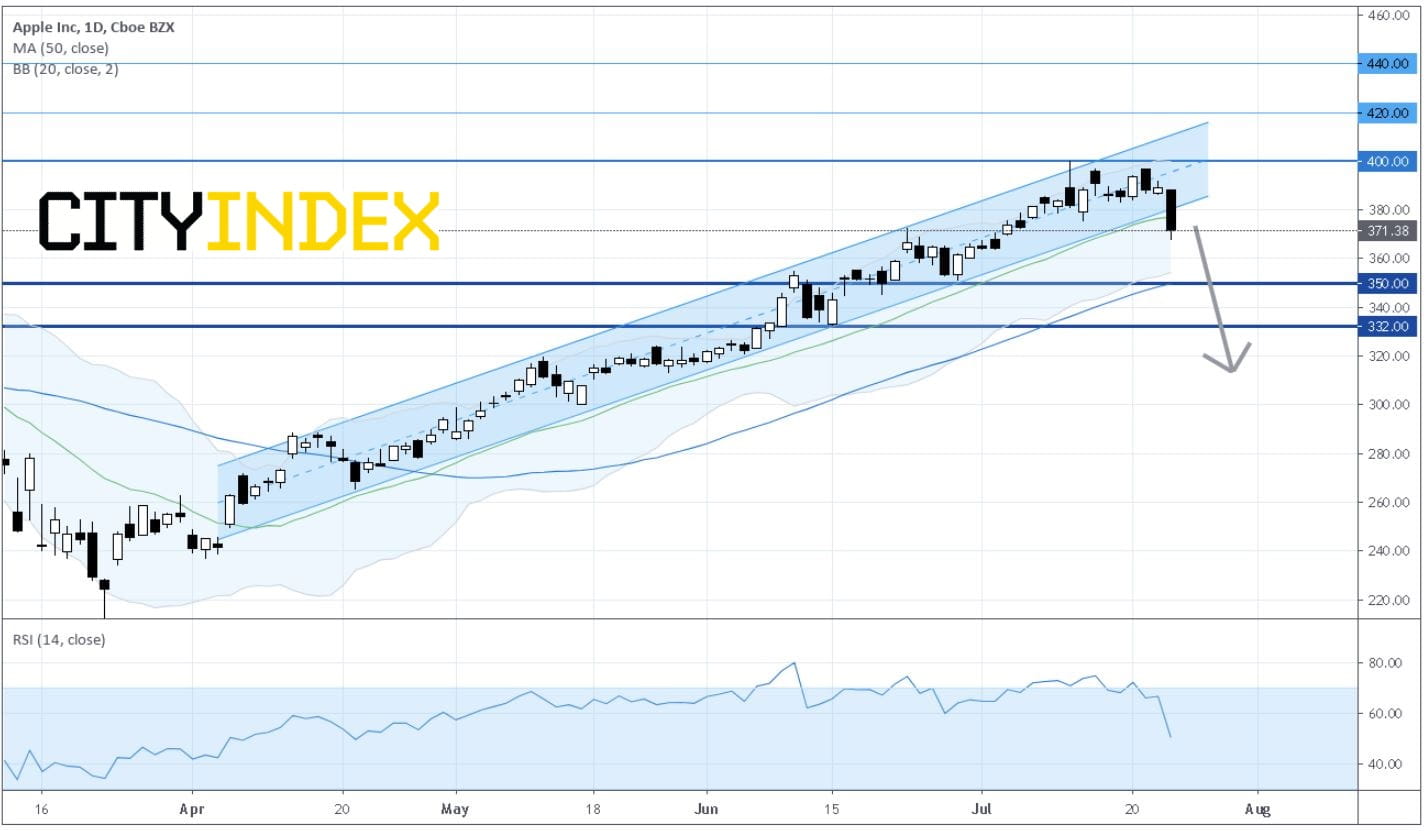
Source: GAIN Capital, TradingView
Unless the Key Resistance at $400.00 (around the intraday high of July 13) is surpassed, the short-term bias remains bearish.
Downside Support would only be found at $350.00 and $332.00.
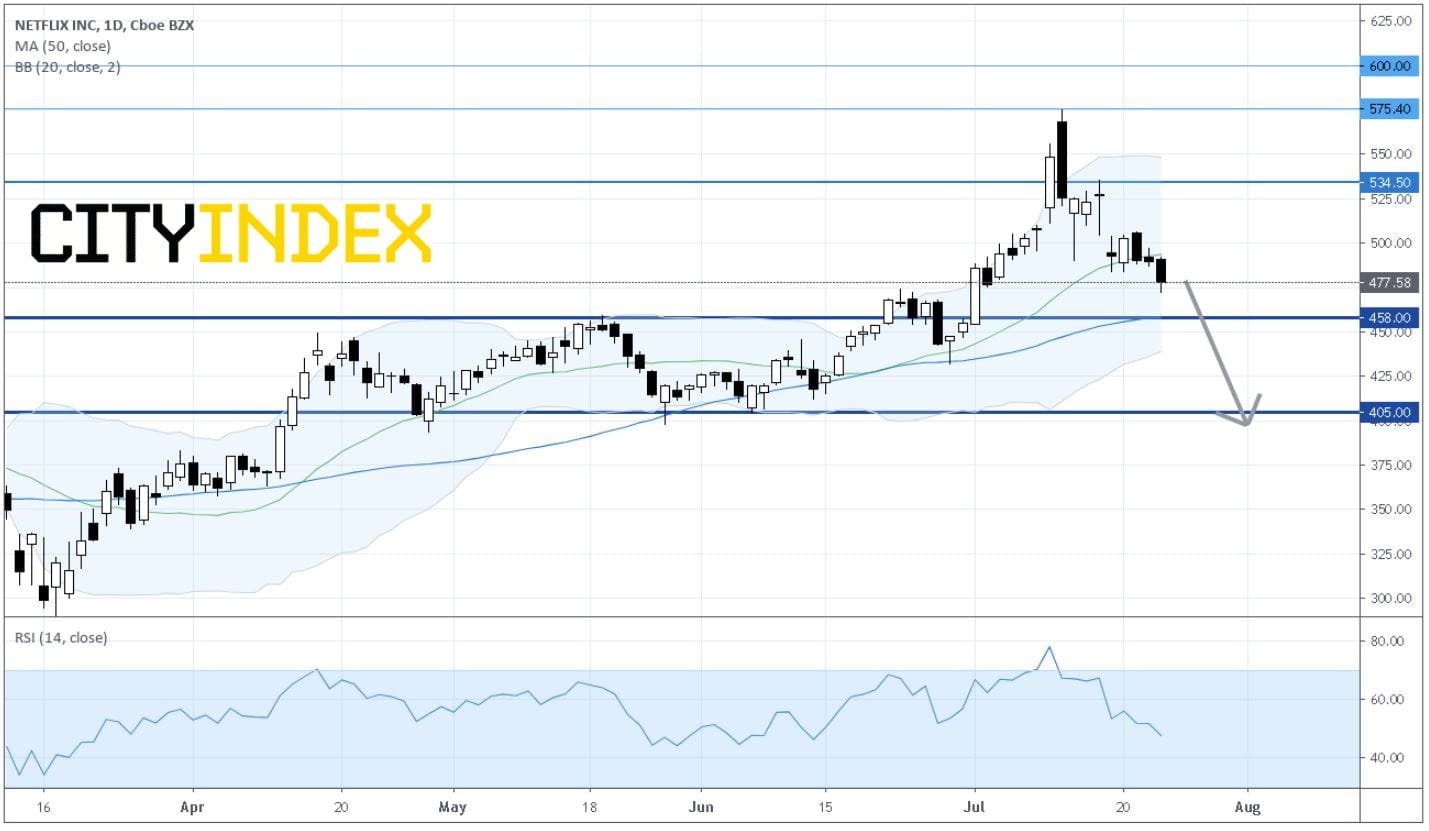
Netflix (NFLX) shows an Inverted-V Bearish Reversal.
Source: GAIN Capital, TradingView
The stock keeps trading on the downside after retreating from an intraday high of $575.40 seen on July 13.
Capped by the Key Resistance at $534.50, the stock has failed to post a sustainable rebound.
Immediate Support is located at $458.00 (around the 50-day moving average), and the next one at $405.00 (around the low of June).
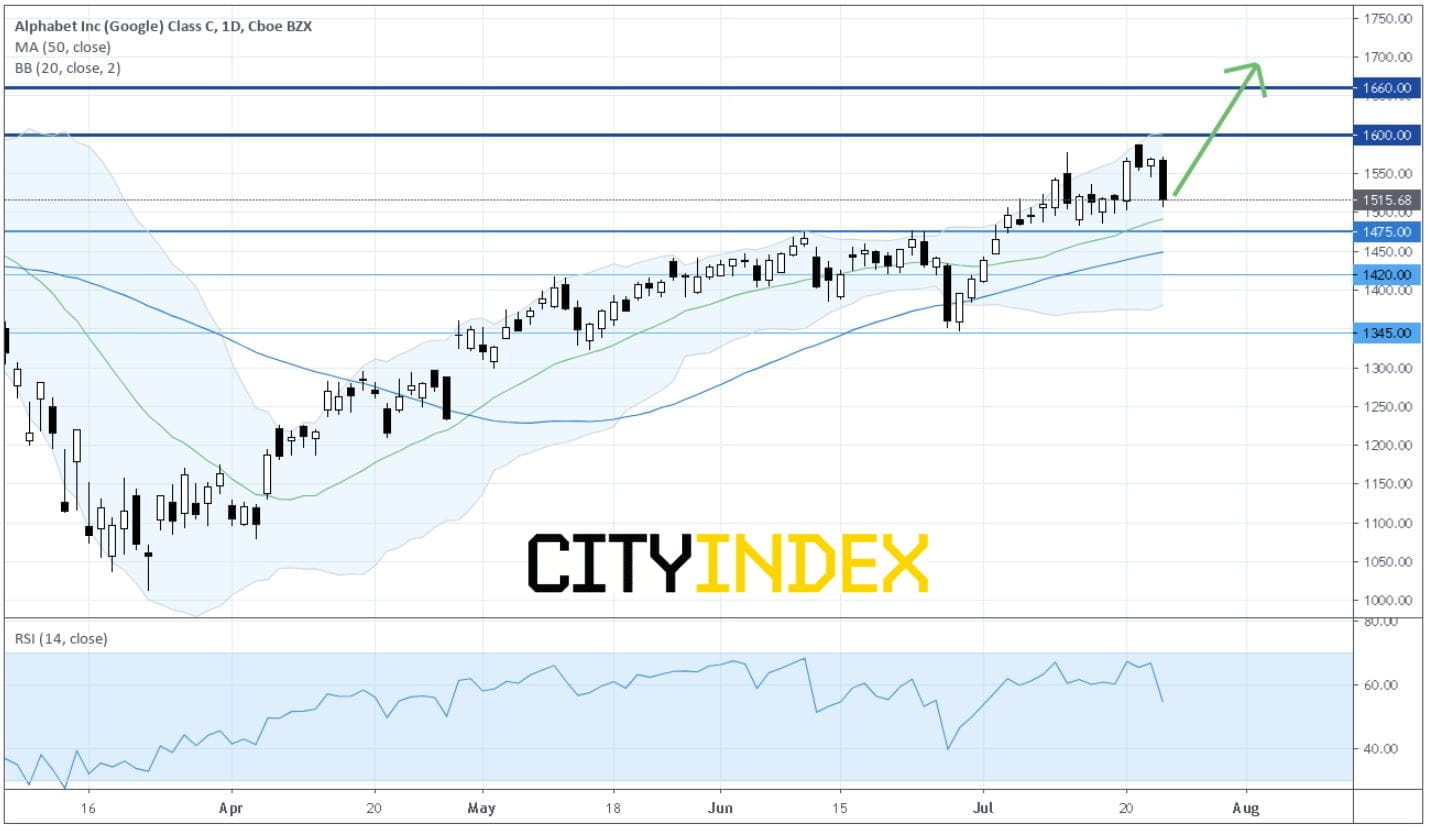
Alphabet (GOOG) is still supported by the ascending 20-Day Moving Average.
While the Dow Jones Industrial Average fell 1.31% and the S&P 500 dropped 1.23%, the tech-heavy Nasdaq 100 slumped 290 points (-2.67%) to 10580, the biggest loss since June 11.
Profit-taking has been seen in tech shares following their recent strong run. Tech giants Tesla (TSLA -5.0%) and Microsoft (MSFT -4.4%) came under pressure after reporting quarterly earnings in late Wednesday.
So, how are the five prominent tech stocks FAANG -- Facebook (FB), Amazon (AMZN), Apple (AAPL), Netflix (NFLX); and Alphabet (GOOG, Google's parent) -- faring at this potential turning point?
Netflix (NFLX) has slumped an accumulative 9.4% since posting downbeat second-quarter earnings last week.
Facebook (FB) will release earnings on July 29 (Wednesday), while Amazon (AMZN), Apple (AAPL) and Alphabet (GOOG) will do so on July 30 (Thursday).
Technical analysis for FAANG stocks are given below.
On a Daily Chart, the Nasdaq 100 Index keeps trading within a Bullish Channel drawn from early April.
Source: GAIN Capital, TradingView
Bullish investors should take the level of 10290 as the Key Support.
Overhead resistance is expected at 11075.
However, caution is advised as the relative strength index has shown a Bearish Divergence. A break below 10290 would send the index down to 9735 (the intraday low of June 29).
Facebook (FB) has failed to re-established a Rising Trend Line.
Source: GAIN Capital, TradingView
The stock has returned to levels Below the 20-Day Moving Average.
And the Relative strength Index is badly directed in the 40s, suggesting a lack of upward momentum.
A further pull-back would bring the stock down to $221.20 and $206.20 (the intraday low of June 29).
Only a return to the Key Resistance at $252.00 would bring about a bullish reversal.
Amazon (AMZN) is shaping up a Bearish "Double-Tops" Pattern.
Source: GAIN Capital, TradingView
It has sunk back to levels around the 20-Day Moving Average.
Further Weakness would bring the stock back to $2830 and $2629 (the low of June 29) on the downside.
Key Resistance is located at $3320 (around the intraday high of July 13).
Apple (AAPL) is dropping down from a Bullish Channel drawn from April.
Source: GAIN Capital, TradingView
Unless the Key Resistance at $400.00 (around the intraday high of July 13) is surpassed, the short-term bias remains bearish.
Downside Support would only be found at $350.00 and $332.00.
Netflix (NFLX) shows an Inverted-V Bearish Reversal.
Source: GAIN Capital, TradingView
The stock keeps trading on the downside after retreating from an intraday high of $575.40 seen on July 13.
Capped by the Key Resistance at $534.50, the stock has failed to post a sustainable rebound.
Immediate Support is located at $458.00 (around the 50-day moving average), and the next one at $405.00 (around the low of June).
Alphabet (GOOG) is still supported by the ascending 20-Day Moving Average.
Source: GAIN Capital, TradingView
In case the Key Support at $1475 is not breached, the stock still stands chances of revisiting $1600 (around the upper Bollinger band) on the upside.
However, a break below $1475 would open a path toward $1420 and $1345 (around the intraday low of June 29).
Latest market news
Yesterday 03:30 PM
Yesterday 01:23 PM
Yesterday 11:00 AM
Yesterday 08:15 AM
Latest Equities articles
April 12, 2024 02:28 AM
April 7, 2024 08:46 PM
March 31, 2024 11:22 AM
