


January 28, 2020 12:04 PM
EUR/USD Slightly Leading DXY
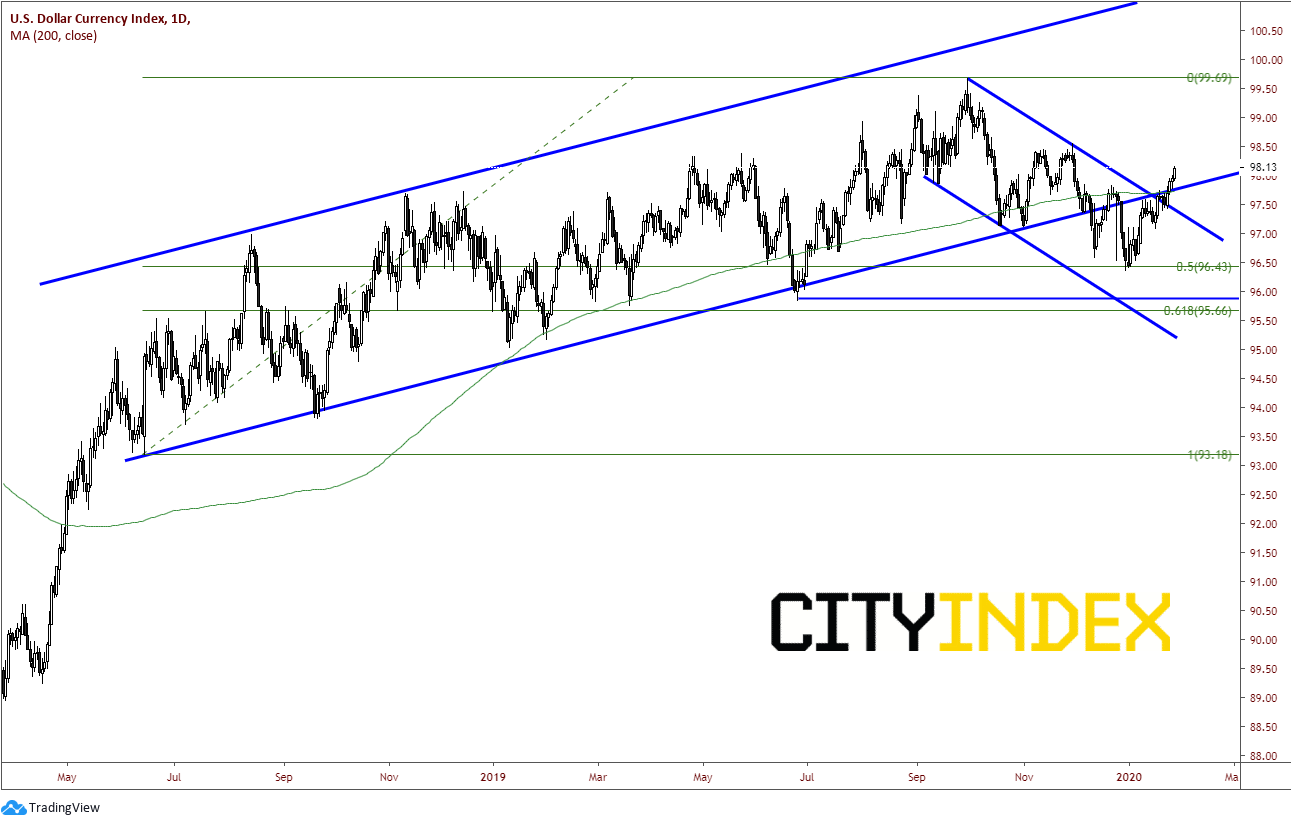
Since January 1st of this new year, the US Dollar Index (DXY) has been on a one way move higher. The index has been in a long-term channel since mid 2018, and finally broke below it in December, only to be halted at the 50% retracement level from the lows on June 13th , 2018 to the highs on October 1st of last year. More recently, over the last 2 weeks, the DXY has broken through a key inflection point near 97.50/97.75. At this level, price broke through:
- The upper trendline of the downward sloping channel, formed off the October 1st highs.
- The bottom trendline line of the upward slopping channel from 2015
- The 200 Day Moving Average
Source: Tradingview, City Index
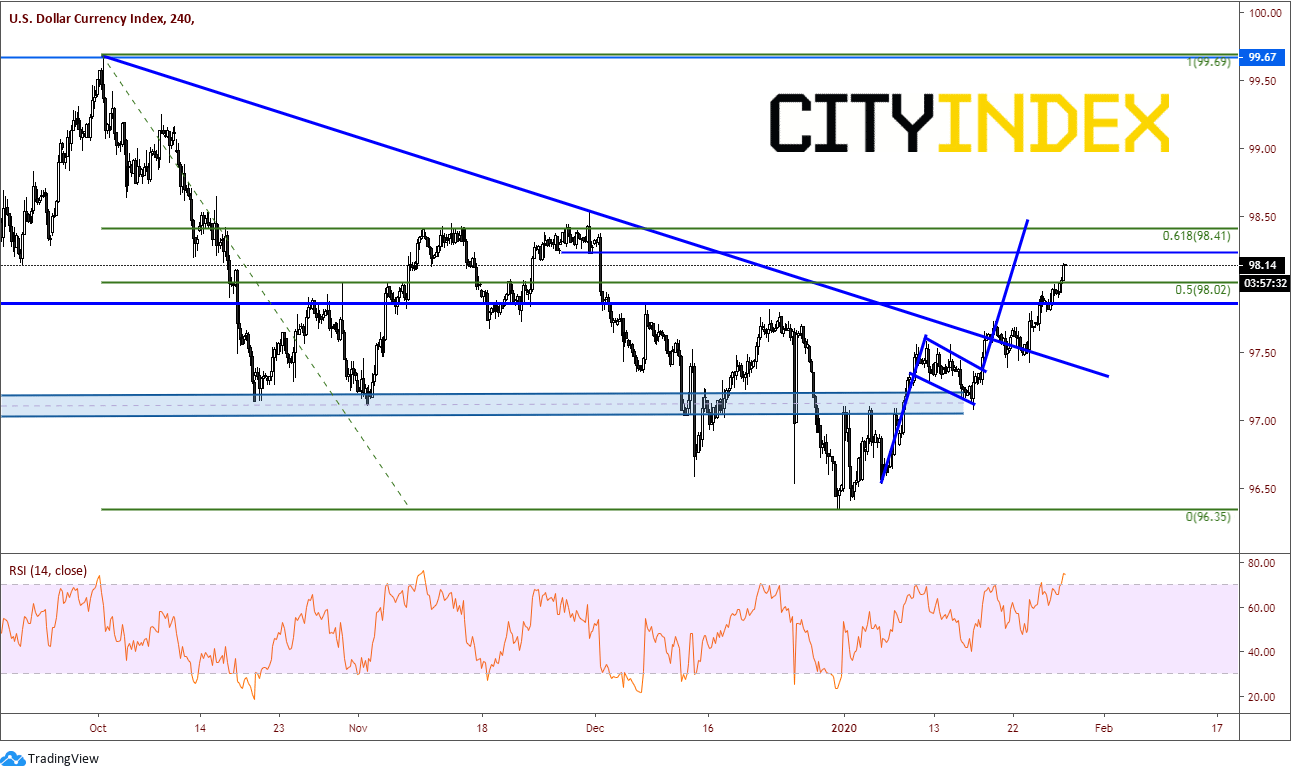
On a 240-minuted chart of the DXY, the upward trend is in full effect. However, there is plenty of resistance just above. Price is currently trading near 98.15. There is horizontal resistance near 98.25, as well as the 61.8% retracement level from the October 1st highs to the December 31sr lows near 98.40. (98.50 is the target for the flag pattern which was formed off the lows as well). On addition, the RSI is over 75. Any reading above 70 is worth watching for possible pullbacks in price.
Source: Tradingview, City Index
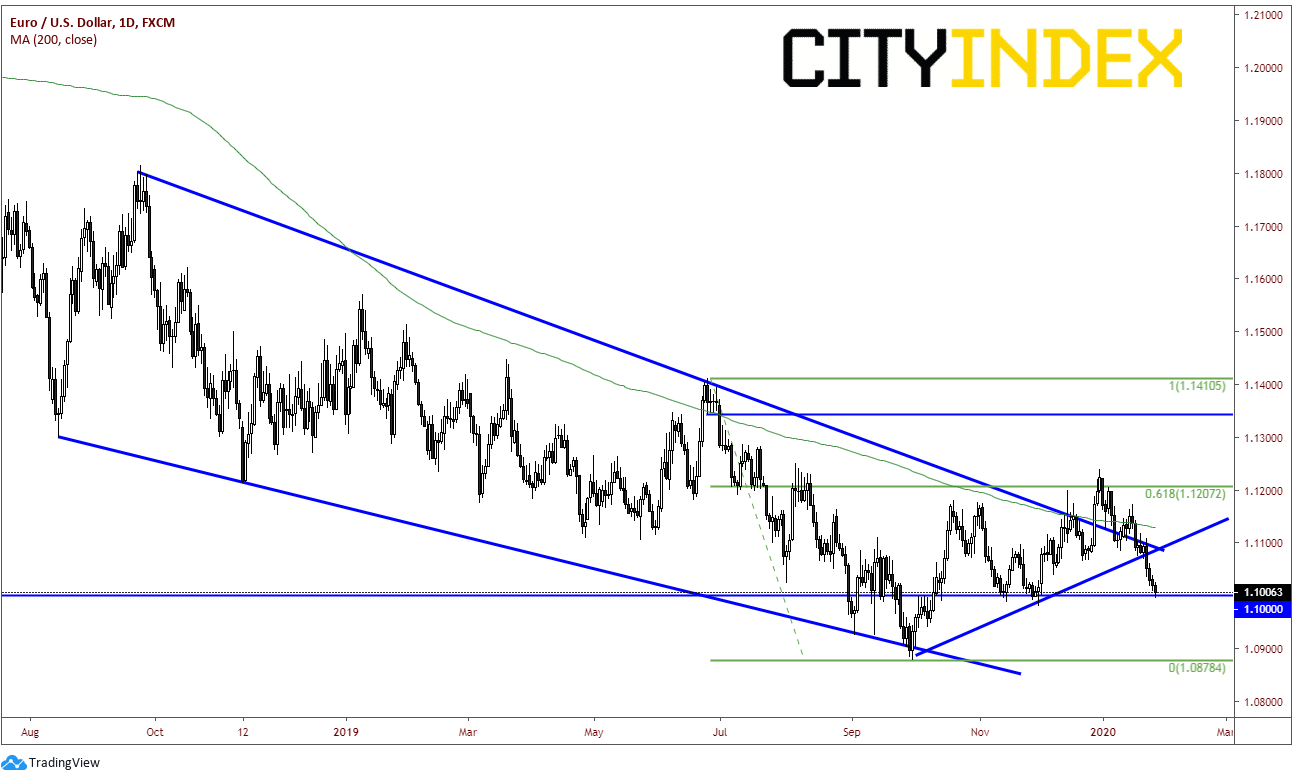
The Euro makes up almost 58% of the US Dollar index. So, it is no surprise that as the US Dollar Index moves higher, the EUR/USD would move lower. The EUR/USD was in a falling wedge since mid-2018, and on December broke higher out of the wedge. Price halted at the 61.8% retracement level from the highs on June 24th to the lows October 1st and reversed. More recently, over the last 2-week, EUR/USD has broken through a key inflection area near 1.1100. Near this level, price broke through:
- The 200 Day moving average near 1.1135
- The upper trendline of the falling wedge
- The rising trendline off the lows from October 1st
Price is currently at horizontal and psychological support near 1.1000.
Source: Tradingview, City Index
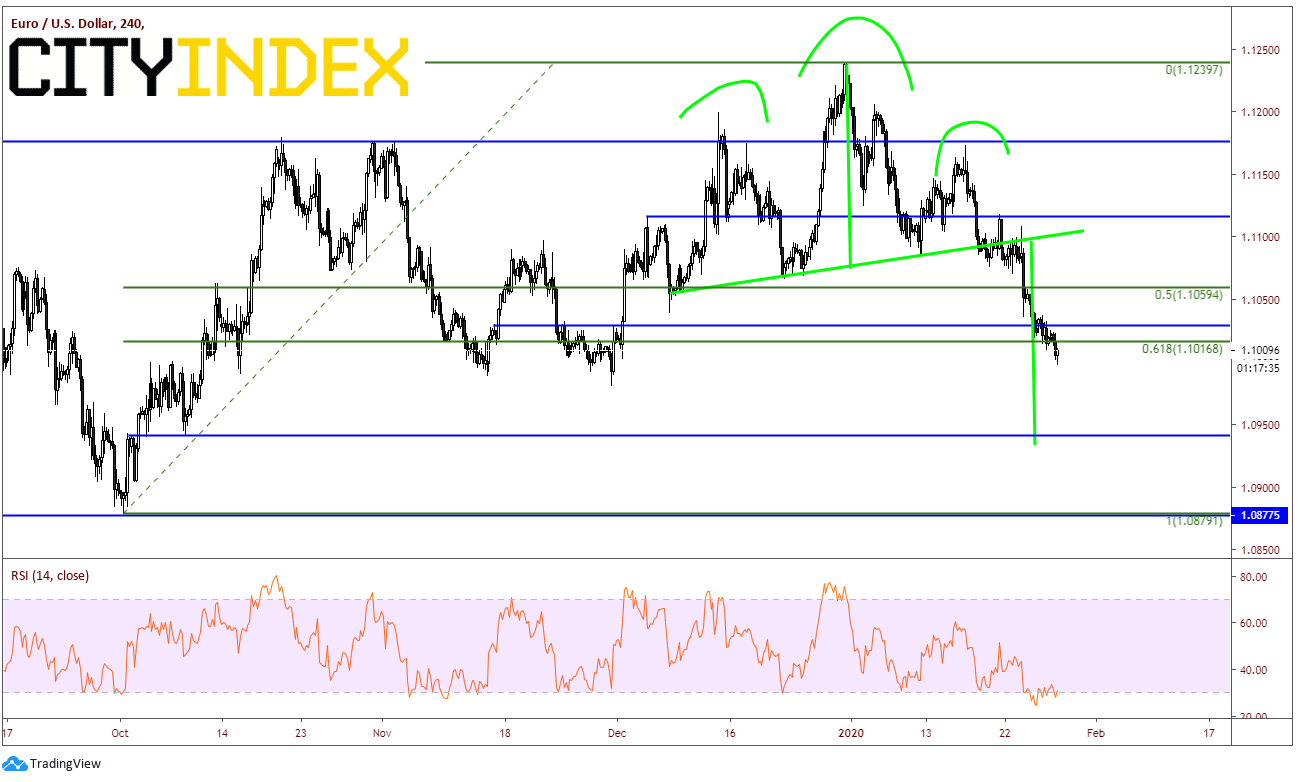
On a 240-minuted chart of the EUR/USD, the downward trend is in full effect. Price has moved lower out of a head and shoulders pattern and has already broken through horizontal support and the 61.8% retracement level from the October 1st lows to the Decmeber31st highs, whereas DXY has not broken through its corresponding levels). In addition, the RSI is oversold and diverging with price, whereas the DXY is not diverging. The target for the head and shoulders pattern is near 1.0935, which is also horizontal support.
Source: Tradingview, City Index
If it turns out to be the case that the EUR/USD is really leading the DXY, one would expect the DXY to push higher through the near term resistance levels.
Latest market news
Yesterday 11:09 PM
Yesterday 11:01 PM
Yesterday 04:00 PM
Yesterday 01:15 PM
Yesterday 11:30 AM
Yesterday 08:18 AM
Latest Dollar articles
Yesterday 11:09 PM
April 18, 2024 06:20 AM
February 16, 2024 11:30 AM
February 7, 2024 03:30 PM