EURUSD plunge set to continue
EUR/USD EUR/USD (daily chart) has been entrenched in a strong bullish trend since the 1.2750 support level was hit with a double-bottom retest in early […]
EUR/USD EUR/USD (daily chart) has been entrenched in a strong bullish trend since the 1.2750 support level was hit with a double-bottom retest in early […]
EUR/USD
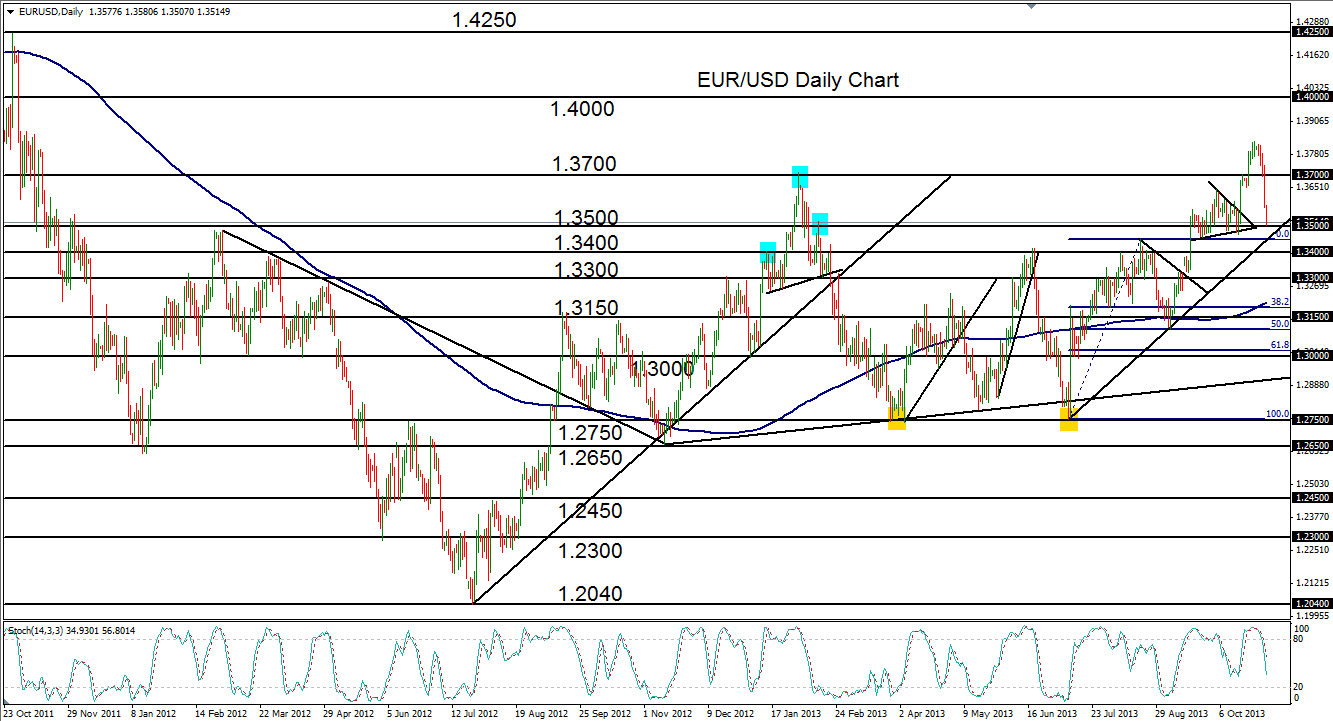
EUR/USD (daily chart) has been entrenched in a strong bullish trend since the 1.2750 support level was hit with a double-bottom retest in early July. After hitting a high of 1.3450 in August, price pulled back around 50% of its prior bullish run, and rebounded strongly to reach for even higher highs. The pair then consolidated in a tight pennant pattern around the key 1.3500 psychological level in September before breaking out to the upside to target the major 1.3700 resistance level.
This 1.3700 high was last reached in February, where it formed the “head” of an eventual head-and-shoulders pattern that broke down to reverse the previous uptrend. The pair reached its 1.3700 target and broke out above it in mid- to late October to target its next major objective at 1.4000. On 25 October, price hit a high at 1.3831, falling short of its 1.4000 target for the time being, before plummeting well below 1.3700 once again.
Despite this plunge, the pair is still currently entrenched in a bullish trend, with the 1.3500 level serving as a tentative support level. Any breakdown below 1.3500 should find further support around the 1.3400 and then 1.3150 levels. To the upside, the key level to watch remains at the noted 1.3831 high, with any breakout above that potentially targeting 1.4000 and then 1.4250.
GBP/USD
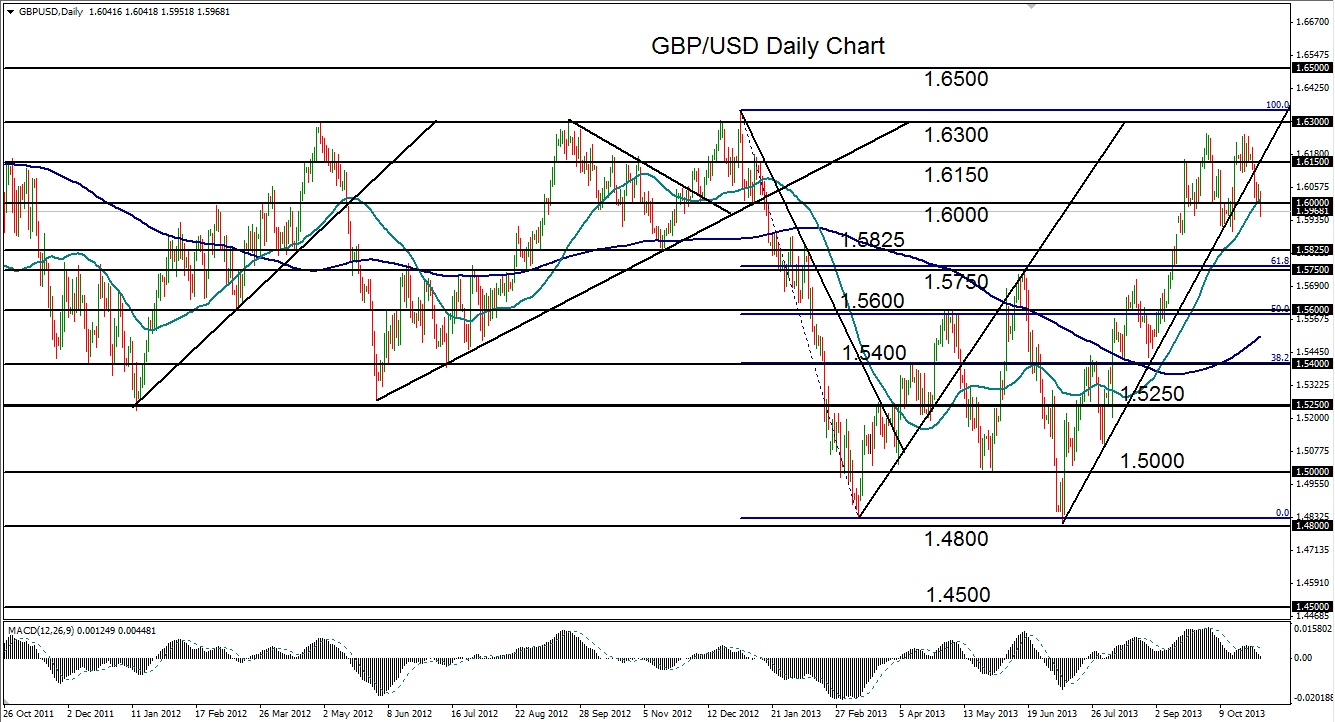
GBP/USD (daily chart) was moving within a steep uptrend that extended back to July’s double-bottom retest just above the 1.4800 support level. Since that low, the pair continued breaking successively higher resistance levels to the point where it is came close to approaching its major resistance objective around 1.6300, which was reached and respected at least three times within the last year and a half. On 1 October and 23 October, the pair rose to within 50 pips of hitting its 1.6300 target before pulling back and plunging to the downside.
After the latest attempt on 23 October, price fell precipitously down below both the 1.6000 level and the 50-day moving average, tentatively breaking down the steep bullish trend line extending from the noted July 1.4800-area low.
Further downside support resides at the 1.5750 level, in which case there is a potential for a reversal or interruption of the recent steep uptrend. A subsequent re-break above the 1.6150 resistance level could open the way for yet another attempt at 1.6300, with any further upside targeting 1.6500.
USD/JPY
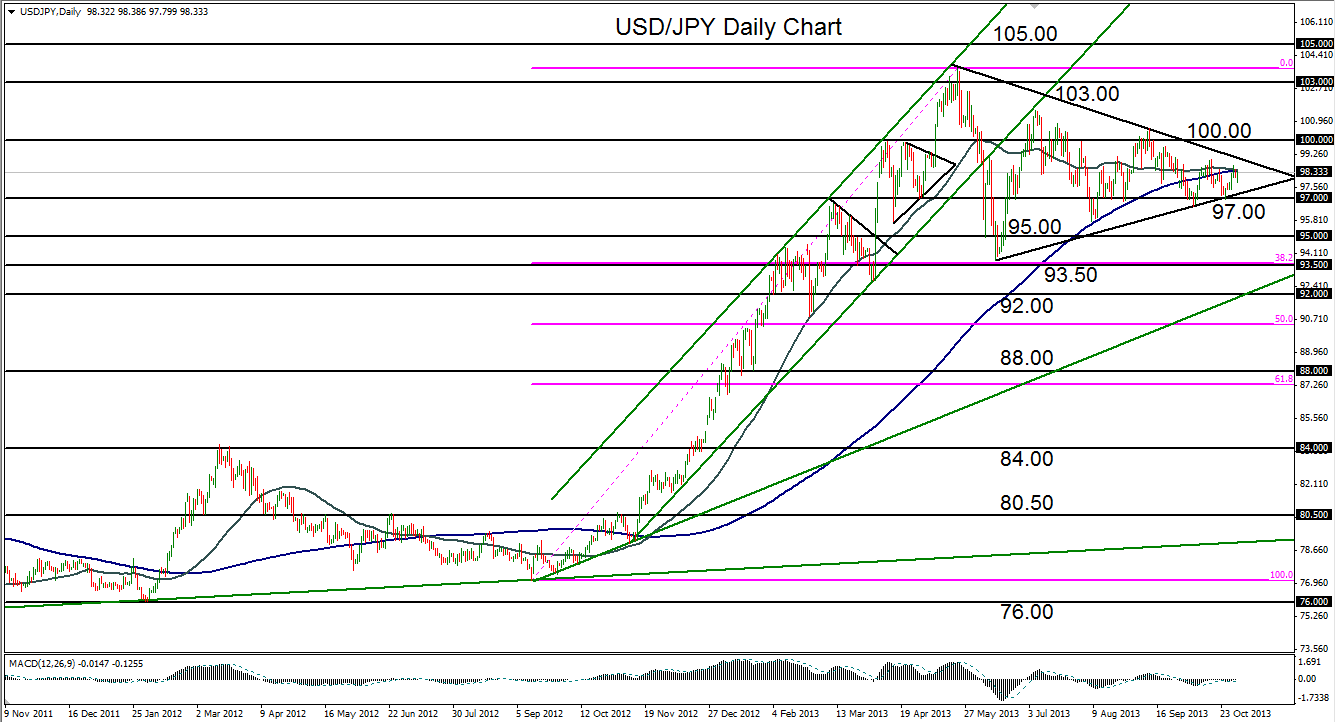
USD/JPY (daily chart) has been in a prolonged sideways consolidation for the past five months since the multi-year high of 103.72 was reached in May. The 50-day moving average has just converged with the 200-day moving average, which reinforces the fact that the current trading range is at or close to the lower extremes of volatility. This progressive decrease in volatility over the past five months has formed a large and rough triangle pattern that frames the boundaries of the converging consolidation.
Most recently, the pair bounced off its key support level at 97.00 on 25 October, which was also the lower boundary of the triangle. Price has subsequently been stalled at the noted convergence of the 50-day/200-day moving averages, which suggests that some type of equilibrium has been reached.
From a technical perspective, the currency pair should soon be poised for a breakout of this consolidation. A breakout above the triangle should have a clear upside objective at the important 100.00 resistance level, followed by 103.00 further to the upside. A breakdown below the triangle and the 97.00 support level should find further downside support around the 95.00 and then 93.50 support levels.
AUD/USD
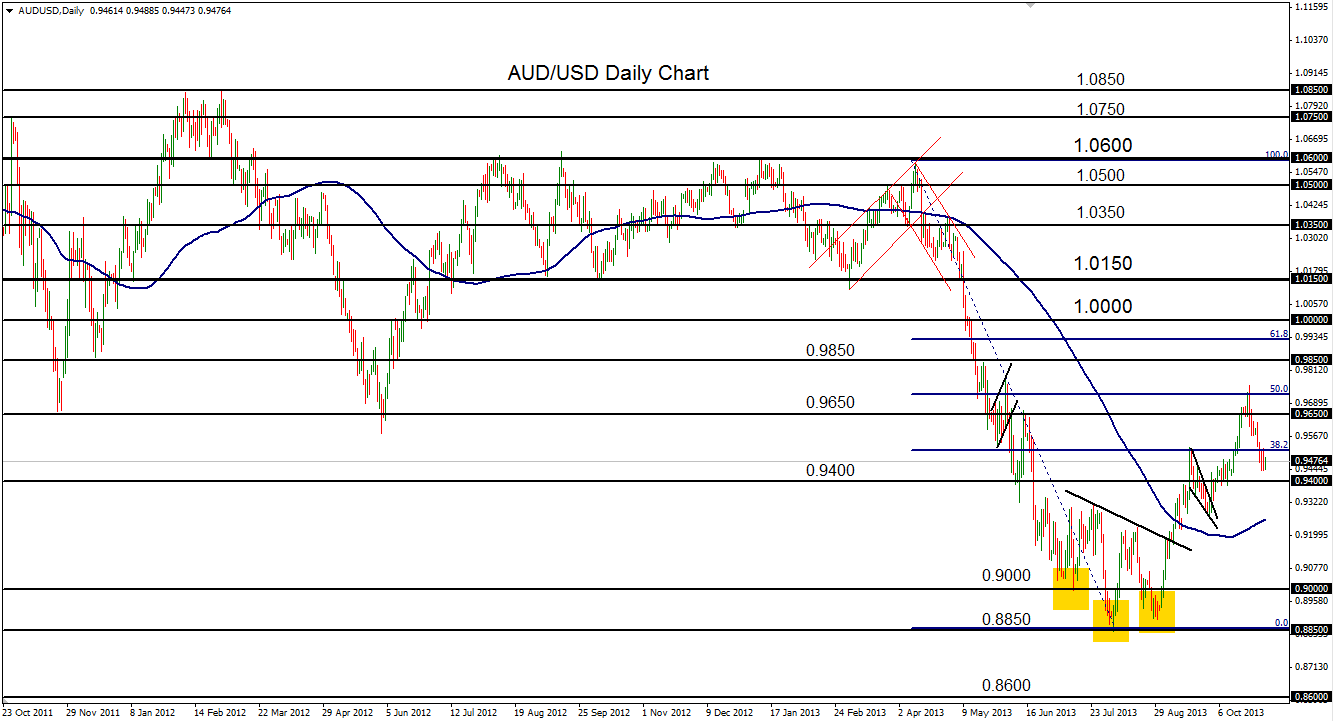
AUD/USD (daily chart) has been rising in a partial recovery after having made a potential trend reversal to the upside in July, August, and September with an inverted head-and-shoulders pattern. The neckline of this pattern was broken to the upside in early September, and price subsequently reached up to a high of 0.9527 before pulling back in a steep falling wedge pattern. The pair then broke out above that pattern to resurface above the 0.9400 level, with an upside target at 0.9650.
The pair broke out above 0.9650 on 18 October to reach a high at 0.9756 on 23 October, missing its 0.9850 price objective for the time being, to pull back sharply down to a level just above 0.9400 once again. A further breakdown below 0.9400 would erase a good portion of the gains made since August, with strong further support down at the 0.9300 level. Any subsequent breakout above the noted 0.9756 high should once again target the 0.9850 price objective with a further upside target around
