


Asian Indices:
- Australia's ASX 200 index fell by -61.1 points (-0.9%) to close at 6,738.40
- Japan's Nikkei 225 index has fallen by -4.06 points (-0.1%) and currently trades at 29,380.46
- Hong Kong's Hang Seng index has risen by 286.17 points (1.01%) and currently trades at 28,624.47
UK and Europe:
- UK's FTSE 100 futures are currently up 21 points (0.31%), the cash market is currently estimated to open at 6,757.17
- Euro STOXX 50 futures are currently up 11 points (0.29%), the cash market is currently estimated to open at 3,893.87
- Germany's DAX futures are currently up 49 points (0.33%), the cash market is currently estimated to open at 14,866.72
Monday US Close:
- The Dow Jones Industrial rose 98.49 points (0.3%) to close at 33,171.37
- The S&P 500 index fell -3.45 points (-0.09%) to close at 3,971.09
- The Nasdaq 100 index fell -13.38 points (-0.1%) to close at 12,965.74
Will indices take note of the rising yields?
Yields may be rising, yet equity markets appear to have turned a blind eye during overnight trade. In Asia the KOSPI 200 and Nikkei 225 led the pack higher +1.2% and +1.02% respectively. The ASX 200 fell to a 5-day low in line with our bias from today’s Asian open report, although that is more likely to be down to Queensland re-entering lockdown due to rising cases in two clusters.
It was only recently that rising yields to current levels would send the Nasdaq falling over 4% in a day. At the time of writing Nasdaq futures are just -7 points lower (-0.06%), whilst S&P 500 and Dow Jones futures are up by 0.11% and 0.15% respectively. Perhaps we’ll see a more dramatic response from these indices at US open, although, being so close to month and quarter end, price action can be erratic and unpredictable anyway. Stay nimble.
The Euro STOXX 50 and DAX closed to fresh record highs yesterday, although their daily ranges were small and both indices closed around their opening prices. In both cases our bias remains bullish above Friday’s low (the gaps) but yesterday’s indecision candles are a slight concern to that bullish case over the near-term. A break beneath yesterday’s gaps would confirm yesterday’s Doji’s as near-term reversals.
The FTSE 100 remains suppressed by its 200-week eMA and yesterday’s indecision candle (Rikshaw man Doji) underscores its hesitancy to break above this milestone level. Still, if it can muster up the strength to break its 200-day eMA then the bias remains bullish towards 6800.
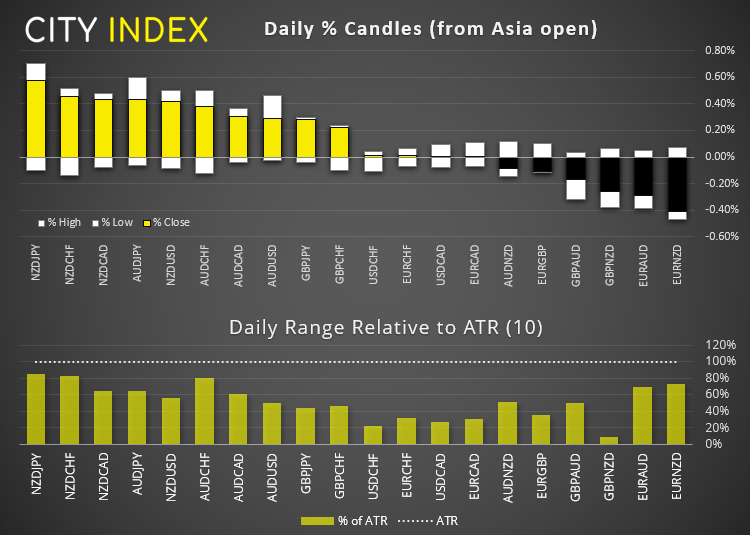
Forex: Dollar remains firm, USD/JPY hits 1-year high
The US dollar index (DXY) touched a 4-month high yesterday and held onto the gains overnight. EUR/USD is stuck near yesterday’s low having closed below 1.1800 for its third consecutive session. With prices below its 200-day eMA and prices having already consolidate near its lows for two days then it must be tempting to bears. However, support is nearby at 1.1745 which makes the reward to risk a bit small to enter on the daily chart.
Retail sales in Japan fell for a third consecutive month, adding to calls for a sharp contraction in Q1 GDP. The Japanese yen was the weakest currency and broadly lower against its major peers which saw USD/JPY finally break above the June 2020 high.
GBP/CHF finally tested 1.3000 yesterday yet failed to hold above it. Now there are two bearish hammers at the highs which closed beneath this resistance level, then we see its potential to retrace lower from current levels. That’s not to say shorting this particular pair would be easy given the strength of its bullish trend overall. But perhaps bulls would be best to wait for a clear break above 1.3000 before loading up.
False break on EUR/GBP?
EUR/GBP is again probing key support at 0.8533 after a (failed) break beneath it. Whilst the daily trend favours further downside eventually, yesterday’s bullish hammer which closed back within range warns of a bear-trap.
It should also be noted that yesterday’s low found support at the weekly and monthly S1 pivot levels. Given the day closed back above the breakout level then we see the potential for a counter-trend move back within its range.
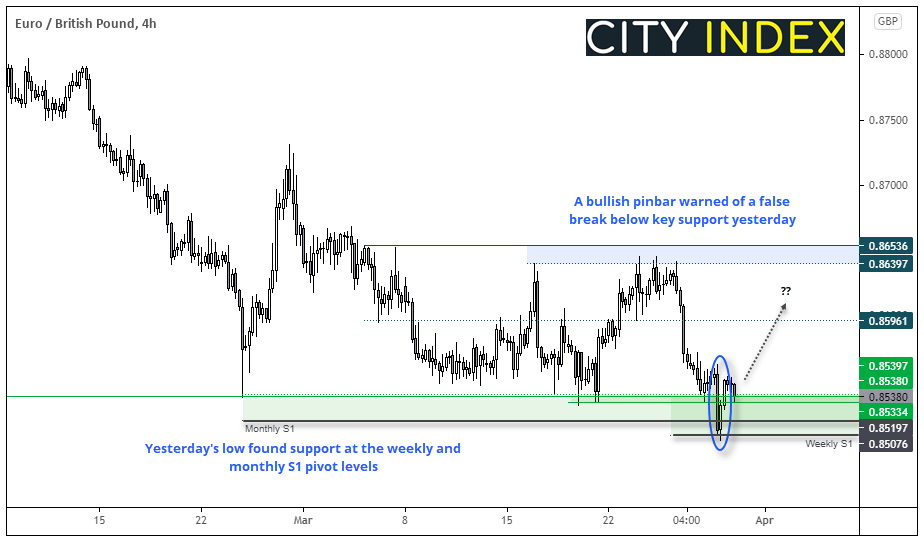
- A break above yesterday’s high assumes bullish follow-through
- The initial target is the lows around 0.8596
- A break beneath yesterday’s low invalidates the near-term bullish bias and assumes the dominant, bearish trend has resumed.
Commodities: Gold falls to a technical juncture
Gold has fallen to a 12-day low and trades around 1706. How prices react around the 1700 bullish hammer low is key. On one hand, bears can make their argument based on the longer-term bearish trend and channel, whilst bulls could point to how major support resides between 1776 – 1700. Should 1700 hold as support then we may have seen the end of wave-2 retracement and wave 3 could then try to break above 1764. Conversely, a break beneath 1700 brings the 1670/76 lows into focus over the near-term.
Palladium remains in a minuscule (almost shell-shock) state since yesterday’s -5% loss. Whilst prices are holding above the 2514 breakout level, we have put this on the back burner until volatility subsides. Ultimately, we see its potential to continue its longer-term bullish trend but the magnitude of yesterday’s candle has put this on the shelf for later.
Oil prices endured a day of trading without moving over 5% (up or down). Given it trades just off its weekly high then it’s a minor victory for bulls. But we need to see a clear break above $65 to become more confident.
Up Next (Times in GMT)
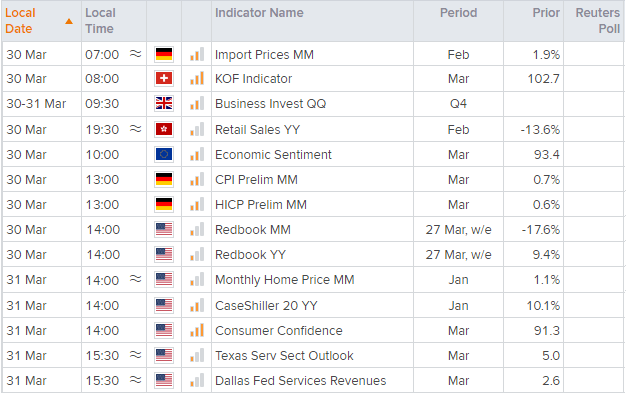
You can view all the scheduled events for today using our economic calendar, and keep up to date with the latest market news and analysis here.
Latest market news
Yesterday 03:00 PM
Yesterday 01:12 PM
Yesterday 11:14 AM
Yesterday 08:28 AM
April 24, 2024 03:30 PM
Latest Equities articles
April 12, 2024 02:28 AM
April 7, 2024 08:46 PM
March 31, 2024 11:22 AM
