


View our guide on the FX Dashboard
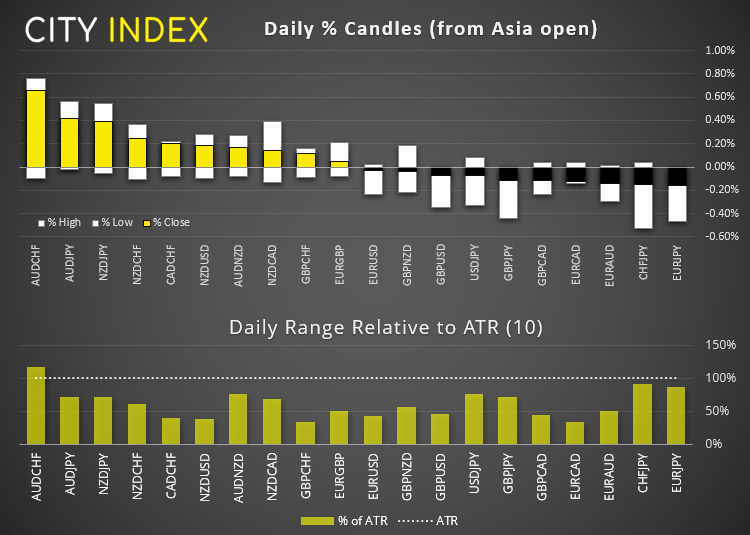
If we look at the forex dashboard it should be noted that moves are measured from the market open. So, in the case of AUD/CHF it is higher than the open yet remains beneath Friday’s close.
Asian Indices:- Australia's ASX 200 index rose by 44.3 points (0.66%) to close at 6,752.50
- Japan's Nikkei 225 index has risen by 31.67 points (0.1%) and currently trades at 29,747.54
- Hong Kong's Hang Seng index has fallen by -76.97 points (-0.27%) and currently trades at 28,913.97
UK and Europe:
- UK's FTSE 100 futures are currently down -20.5 points (-0.31%), the cash market is currently estimated to open at 6,688.21
- Euro STOXX 50 futures are currently down -10 points (-0.26%), the cash market is currently estimated to open at 3,827.02
- Germany's DAX futures are currently down -55 points (-0.38%), the cash market is currently estimated to open at 14,566.00
Friday US Close:
- The Dow Jones Industrial fell -234.33 points (-0.71%) to close at 32,627.97
- The S&P 500 index fell -2.36 points (-0.07%) to close at 3,913.10
- The Nasdaq 100 index rose 77.89 points (0.61%) to close at 12,866.99
Indices: Europe set to open lower
Futures markets were in the red early in the session as investors weighed up the impact of the falling Turkish lira. Yet that’s not to say that these moves will persist, and European indices remain in strong uptrends anyway. So it will be a case of monitoring key levels early on to see if there is follow-through, or whether the calamity of the Lira can be quickly shaken off.
- The Euro STOXX 50 is set to open lower today. Friday’s bearish candle from its highs tested 3818.12 support and a break beneath it suggests a counter-trend retracement is underway.
- The DAX closed the gap around 14,600 (and closed inside of it). So today we will wait to see if Friday’s bearish close is extended as part of a counter-trend retracement. The next major support level is 11,410.
- The CAC gapped lower on Friday and we suspect a retracement is officially underway after posting strong gains last week. However, prices need to break beneath the 10-day eMA which is closed upon on Friday.
- The FTSE closed -1.1% on Friday and its intraday low was just under -1.8%. The bias is for a move to around 6600 as long as prices remain below 6800 – 6818. Of all the indices mentioned, the FTSE appears to be the weakest so could favour bears if sentiment is sour.
Forex: The Turkish lira rallied over 17% today
The star of the overnight session was USD/TRY which rallied over 17%. The Turkish Lira was in freefall as markets responded to news over the weekend that President Ergon had fired his Central Bank Governor, for raising interest rates to fend off double-digit inflation. USD/TRY has since pared earlier gains and trades around 8.05, up a ‘mere’ +11.5% from Friday’s close.
The US dollar index probed Friday’s high and is currently on track for a small bullish engulfing candle.
- GBP/USD is holding above its 50-day eMA but currently trading lower for a third consecutive session. Until we see a break above 1.4000 or beneath the 1.3780 region then range-trading strategies are preferred on the daily timeframe.
- EUR/GBP has probed Friday’s high and trades just below 0.8600. Last week it failed to break key support 0.8538 and is now up for a second consecutive session, so we’re on guard for a break above 0.8600.
- EUR/USD is back below 1.1900 although prices are trying to carve out a base around 1.1875. f today’s low holds then we see the potential for a minor bounce from current levels, just keep in mind that not much us scheduled in today’s calendar so ranges might be smaller than usual.
- EUR/NZD is probing a bearish trendline – check out the Asian open report for technical levels and more details.
GBP/JPY: Retracement complete?
The bullish trend on GBP/JPY remains firm although prices are now within their third consecutive down day. Yet a potential ‘buying tai’ (lower wick) is in the making after finding support above the 20-day eMA and 50% retracement level. In fact prices have now recovered above the 38.2% Fibonacci ratio and the daily candle is forming a bullish hammer (obviously this is yet to be confirmed). But if we see bullish follow through after the open then it could be of interest.
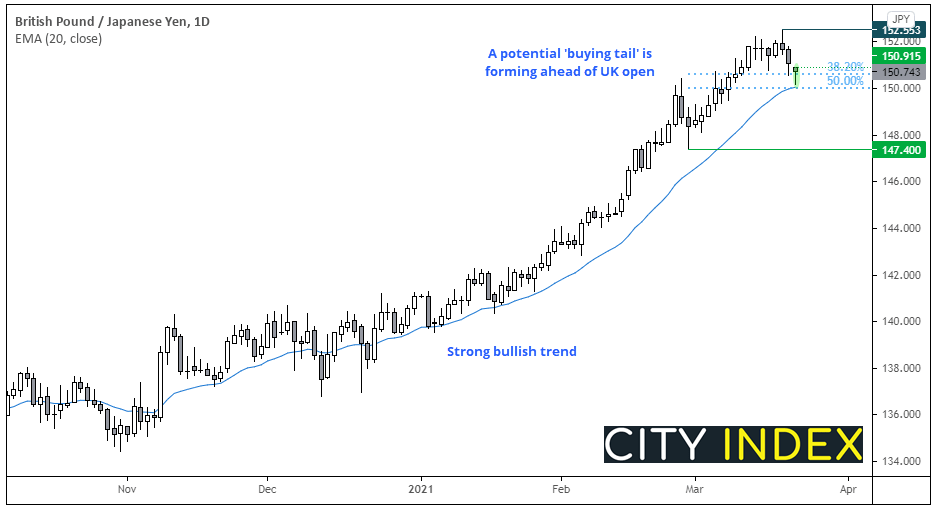
- A break above today’s high suggests the daily low may have been set.
- Initial target is just below the 152.55 high.
- If the correction really is complete then price should eventually print new highs.
- A break beneath today’s low invalidates the bullish bias.
Commodities:
WTI traded slightly lower overnight, and currently down -0.5% after finding resistance at the broken trendline. It’s not uncommon to see prices crawl along the trendline which acts as dynamic resistance, and we see the potential for another leg lower as long as 62.00 - 63.13 holds as resistance.
Price action remains choppy on gold’s daily chart. But the potential for a swing high remains whilst 1755.50 caps as resistance, yet a break above 1760 – 1764 could trigger bullish follow-through.
Up Next (Times in GMT)
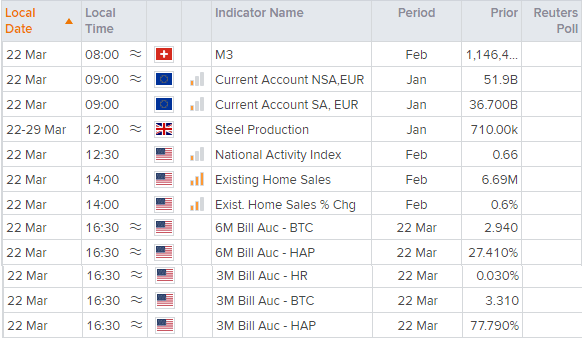
You can view all the scheduled events for today using our economic calendar, and keep up to date with the latest market news and analysis here.
We are not presented with the most exciting calendar today. Although Jerome Powell is speaking at about “How Can Central Banks Innovate In The Digital Age” at 13:00. And that could float a few boats for crypto fans if deemed Bitcoin-friendly enough.
Latest market news
Yesterday 01:23 PM
Yesterday 06:01 AM
April 18, 2024 11:27 PM
April 18, 2024 04:46 PM
Latest Equities articles
April 12, 2024 02:28 AM
April 7, 2024 08:46 PM
March 31, 2024 11:22 AM
