
UK and Europe:
Friday US Close:


Powell also said that the principles risk to the economy is that the disease would spread again, and the recovery would be uneven. Yet the Fed feel like the economy is about to start growing with job creation “much more quickly”. For those reasons, the Fed want to keep strong policies in place, even if inflation is to rise above their target. There was little reaction from markets overnight, but it is at least a step in the right direction for those (patiently) waiting for a hawkish Fed.
Asian Indices:- Australia's ASX 200 index fell by -30.3 points (-0.43%) and currently trades at 6,964.90
- Japan's Nikkei 225 index has fallen by -154.75 points (-0.0052%) and currently trades at 19,614.95
- Hong Kong's Hang Seng index has fallen by -281.56 points (-0.98%) and currently trades at 28,417.24
UK and Europe:
- UK's FTSE 100 futures are currently down -23 points (-0.33%), the cash market is currently estimated to open at 6,892.75
- Euro STOXX 50 futures are currently down -3 points (-0.08%), the cash market is currently estimated to open at 3,975.84
- Germany's DAX futures are currently down -22 points (-0.14%), the cash market is currently estimated to open at 15,212.16
Friday US Close:
- The Dow Jones Industrial rose 297 points (0.0089%) to close at 33,800.60
- The S&P 500 index rose 31.63 points (0.78%) to close at 4,128.80
- The Nasdaq 100 index fell -19.71 points (-0.14%) to close at 13,845.06
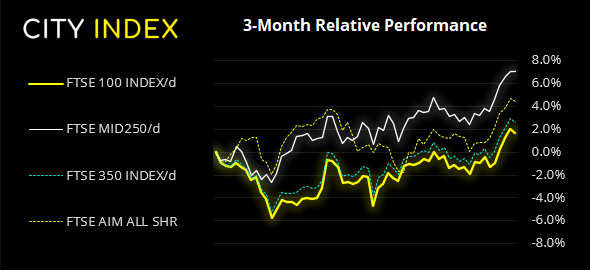
FTSE 100: Market Internals
Despite a soft close on Friday, the FTSE 100 enjoyed its most bullish week since early January, gaining 2.65% for its second-best week this year. Large-cap mining stocks weighed on the broad index and travel stocks fell -1.3, after JetStar cancelled holidays until late June due to uncertainty surrounding international travel during the governments reopening plans. British American Tobacco was the weakest performer after JP Morgan downgraded the stock from overweight to neutral.
FTSE 100 (-0.38%) 09 April 2021:
- 48 (47.52%) stocks advanced and 51 (50.50%) declined
- 87.13% of stocks closed above their 200-day average
- 83.17% of stocks closed above their 50-day average
- 92.08% of stocks closed above their 20-day average
- 3 hit a new 52-week high, 0 hit a new 52-week low
Outperformers
- + 5.11% - JD Sports Fashion PLC (JD.L)
- + 2.43% - Spirax-Sarco Engineering PLC (SPX.L)
- + 2.18% - Weir Group PLC (WEIR.L)
Underperformers:
- 5.11% - British American Tobacco PLC (JD.L)
- 2.43% - BAE Systems PLC (SPX.L)
- 2.18% - International Consolidated Airlines Group SA (WEIR.L)
Asian shares lower ahead of US earnings season
After strong gains last week, traders booked profits today ahead of earnings seasons in the US, where investors will find out if the record highs on the Dow Jones and S&P 500 are justified.
The Hang Seng fell to seven-day low and it looks increasingly likely that Friday’s high was an interim top. The index produced two “Dark Cloud Cover” reversal patterns on the daily chart last week and today’s break lower confirms the near-term reversal patterns.
The ASX 200 was also under pressure, falling -0.4% from its 13-month high. Whilst a retracement could be expected following its string rally last week, bulls now need to depend 6938 support to avoid a retracement turning into something a bit nastier.
With the slightly-soured sentiment in Asia and index futures for Europe and US also pointing lower then traders can expect a soft open for cash markets today.
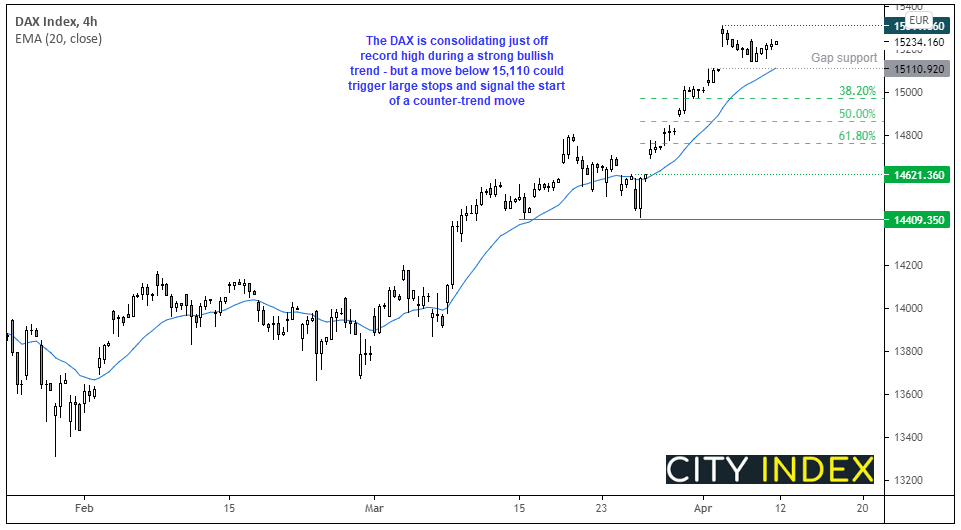
The DAX has remain firm and just below its record high, as a shallow retracement occurred last week. Price action has not quite closed the gap support level, but the fact it remains untested could be taken as a bullish sign.
However, with the German Federal government looking to have more control over a nationwide lockdown, perhaps it could knock this bullish DAX off of its perch if harsher conditions are indeed implemented.
- Whilst volatility remains low then retracements towards 15,110 support are likely to be snapped up by bulls.
- A break above 15,312 assumes bullish continuation of its dominant trend.
- A convincing break below 15,110 signals counter-trend phase has begun. And this might happen quite quickly if large stop are resting below this technical level.
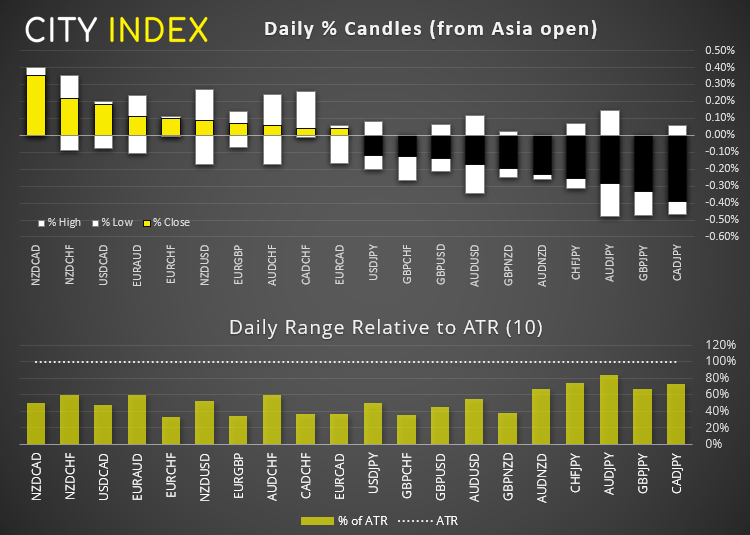
Forex: Dollar index remains in a 0.5 point range
The US dollar index (DXY) held above 92.00 support last week and printed am inverted hammer on Friday. Note that DXY spent the entre week between 92.00 and 92.50 so, until we see a break out of this range, we may find price action to be on the choppy side.
- The British pound suffered broad losses last week, in particular against the Swiss franc and Japanese yen. Both GBP/CHF and GBP/JPY are trading within Friday’s range, but struggling to garner much bullish interest. Yet whilst their trends point lower their reward to risk ratios are less appealing to bears around current levels.
- GBP/USD closed lower every day last week and is trying to build support above the March low. A break beneath of which brings the 1.3600 handle into focus, but if it holds support then the 50-day eMA (which sits just below 1.3800) is the next resistance level on the daily chart.
- EUR/GBP closed at a 6-week high on Friday, although bullish momentum is waning on the intraday charts and Friday produced an indecision candle (Spinning Top Doji). But it is above its 50-day eMA so if prices remain above 0.8645 (Friday’s low and a pivotal level) then bulls could target resistance around 0.830.
- EUR/NZD didn’t quite reach our 1.7000 target but two bullish hammer on the four-hour chart suggest support is around 1.6840/66.
- CAD/JPY has retraced to Thursday’s hammer high during overnight trade. If prices can now build support around 87.20 and break above Friday’s high, the bias is then for a run towards the 88.30 high. See today’s Asian open report for the chart:
Commodities: Gold is down, but not out
Gold is slightly lower by -0.3% and trades around 1738. It found resistance at 1760 on Friday and could potentially provide a deeper correction, given the 50-day eMA also capped as resistance. However, an hourly bullish spike shows demand at 1731.15, so we see potential for a minor bounce (at least) from this level should it be tested. A break below 1730 brings 1720 into focus.
Copper prices are back below $4.00 and closed the upside gap created when it broke out of a symmetrical triangle on the daily chart, invalidating the bullish bias.
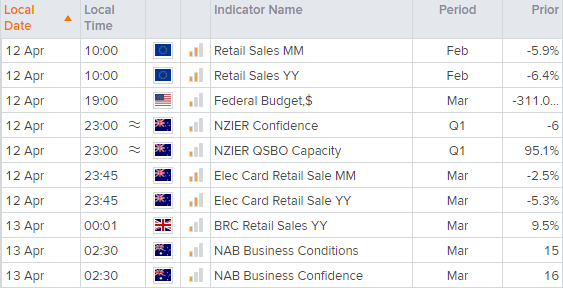
Up Next (Times in BST)
You can view all the scheduled events for today using our economic calendar, and keep up to date with the latest market news and analysis here.
Latest market news
Today 08:28 AM
Yesterday 03:30 PM
Yesterday 01:23 PM
Yesterday 11:00 AM
Yesterday 08:15 AM
Latest Dax articles
Yesterday 08:15 AM
April 17, 2024 11:00 AM
April 17, 2024 07:55 AM
April 17, 2024 04:47 AM