


Asian Indices:
- Australia's ASX 200 index rose by 13.3 points (0.18%) and currently trades at 7,392.80
- Japan's Nikkei 225 index has fallen by -120.83 points (-0.41%) and currently trades at 29,321.23
- Hong Kong's Hang Seng index has fallen by -82.42 points (-0.29%) and currently trades at 28,556.11
UK and Europe:
- UK's FTSE 100 futures are currently up 13 points (0.18%), the cash market is currently estimated to open at 7,185.48
- Euro STOXX 50 futures are currently up 2 points (0.05%), the cash market is currently estimated to open at 4,145.52
- Germany's DAX futures are currently up 11 points (0.07%), the cash market is currently estimated to open at 15,740.52
US Futures:
- DJI futures are currently down -94.42 points (-0.27%)
- S&P 500 futures are currently up 15 points (0.11%)
- Nasdaq 100 futures are currently up 0.75 points (0.02%)
Learn how to trade indices
Indices mixed across Asia
Japan’s exports may have missed the 51.3% forecast, but at these large numbers we could argue the miss is negligible anyway. It provided a slight hint of risk-on across FX markets yet made little impact on equities which are fully focussed on today’s FOMC meeting. With Wall Street closing lower yesterday, Asian equities were unable to buck the trend and the picture was mixed overall, with the TOPIX leading gains, the ASX 200 rising to a new record (and momentarily above 7400) whilst the hang Seng and CSI300 were -0.23% and -1.3% lower respectively.
European futures have opened a touch higher and the FTE 100 is set to open around 7185, just beneath yesterday’s high and at our initial resistance zone noted below. Whilst it couldn’t quite hold above Monday’s bearish hammer, it is the FTSE’s highest close in 16 months (on rising volume). So early in the session we’d like to see prices hold above the 7166 – 7172 support zone to suggest its intraday trend may turn out to be bullish.
FTSE 100 S/R Levels
- R3: 7220
- R2: 7200 - 7204
- R1: 7185 – 7189.63
- S1: 7166 – 7172
- S2: 7159
- S2: 7147
- S3: 7138
- S4: 7129
- S5: 7118 - 7123
FTSE 350: Market Internals
FTSE 350: 7172.48 (0.36%) 15 June 2021
- 129 (36.75%) stocks advanced and 202 (57.55%) declined
- 22 stocks rose to a new 52-week high, 3 fell to new lows
- 86.32% of stocks closed above their 200-day average
- 23.08% of stocks closed above their 20-day average
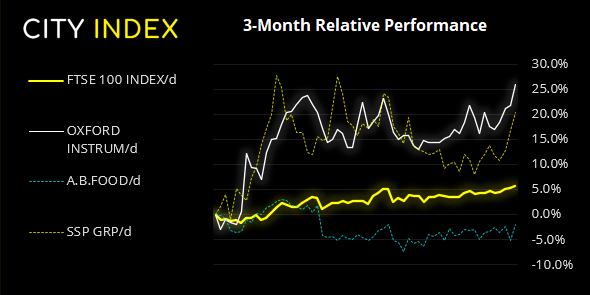
Outperformers:
- + 3.46% - Oxford Instruments PLC (OXIG.L)
- + 3.27% - Associated British Foods PLC (ABF.L)
- + 2.97% - SSP Group PLC (SSPG.L)
Underperformers:
- -6.51% - Hammerson PLC (HMSO.L)
- -4.16% - CMC Markets PLC (CMCX.L)
- -4.15% - Antofagasta PLC (ANTO.L)
Forex:
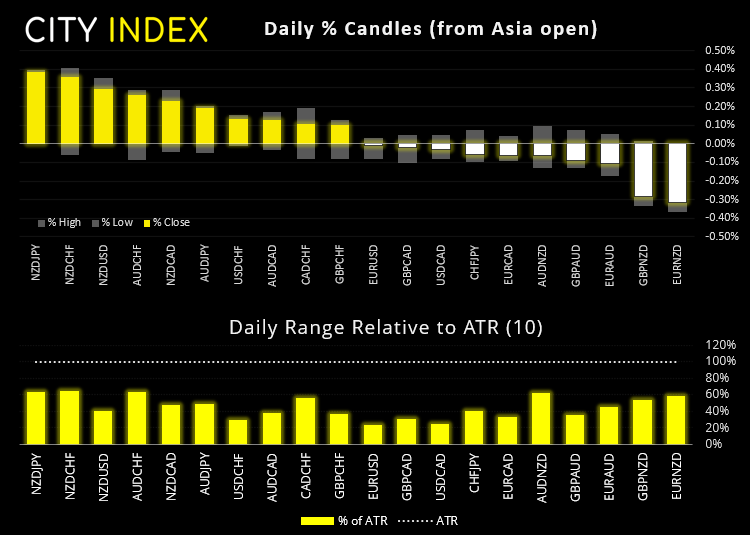
It was a slight risk-on tone in currency markets overnight with NZD and AUD being the strongest currencies whilst CHF and JPY were the weakest.
GBP/USD fell to a four-week low yesterday before finding support at its 50-day eMA and forming a lower wick. 1.4000 remains a key level for bulls to defend and a dovish meeting could send cable higher form current levels. (Also keep an eye on inflation data in the UK up shortly at 07:00 BST). GBP/JPY has refrained from breaking higher yet our bias remains bullish above the 154.10 swing low.
USD/JPY is consolidating above the 110 handle and currently trading around 110.09, leaving 24 pips of upside potential to the 110.33 high. Keep in mind the monthly R1 pivot is at 110.40, but a break above it brings the 110.55 high into focus. Should the dollar turn lower then 109.95 is a key swing low to break for the bear camp.
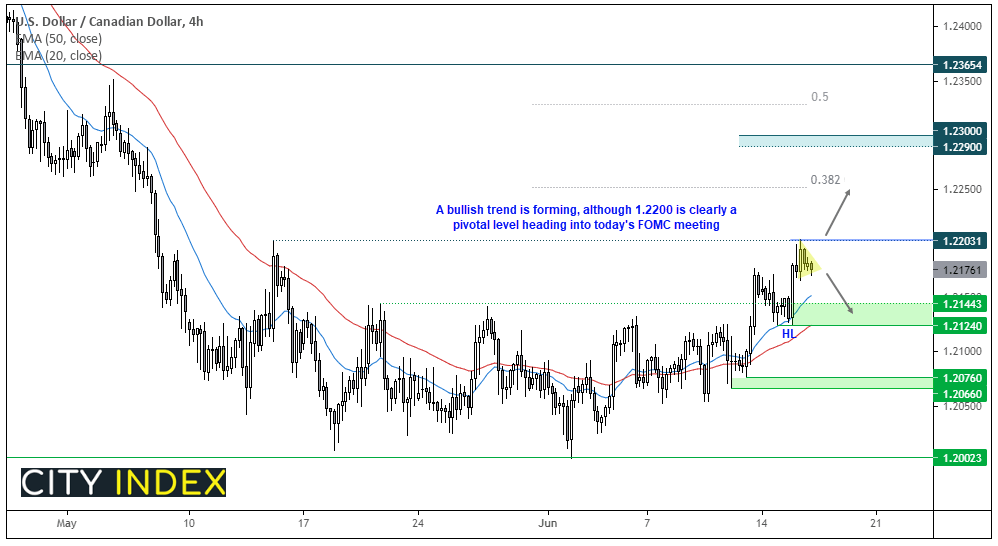
USD/CAD created a higher low at 1.2124 and rallied up to our initial target at 1.2200. This slightly muddies the ‘clean breakout’ of the rounding bottom pattern, yet the structure continues to look bullish. Prices are consolidating below resistance and a breakout above 1.2203 brings the 38.2% Fibonacci ratio into focus ahead of the 1.2300 target.
However, for this scenario to play out nicely we’ll likely need a more-hawkish-than expected FOMC meeting and/ or lower oil prices (which is not likely the consensus either). So be on guard for a move lower should oil prices continue to rally, and the dollar fall after FOMC. A break beneath 1.2124 invalidates our bullish bias.
Learn how to trade forex
Metals remain under pressure ahead of the Fed
Gold traded lower for a fourth consecutive session as traders remain cautious that the Fed could mention tapering at today’s FOMC meeting. Currently trading around 1858, its daily range has been typically low as we’d expect ahead of a central bank meeting, which means volatility awaits. 1854.44 is a key level for bulls to defend as it’s Monday’s hammer low and the 50-day eMA.
Copper remained stuck to yesterday’s low after closing beneath 4.375 support due to fears that Beijing will again try to curb commodity prices. It remains above the October trendline support level and could potentially remain above it (and bounce) should the Fed remain dovish.
Up Next (Times in BST)
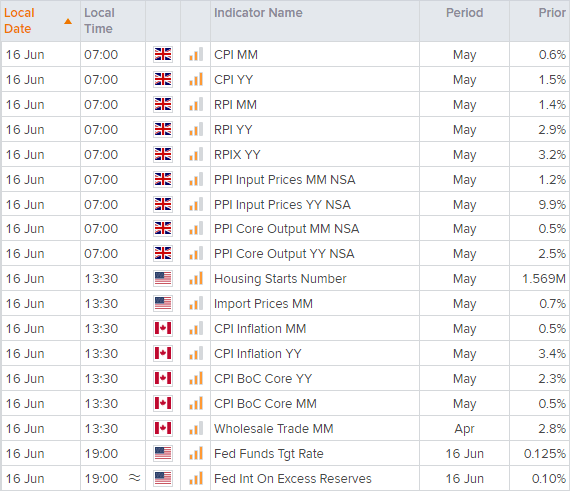
You can view all the scheduled events for today using our economic calendar, and keep up to date with the latest market news and analysis here.
Latest market news
Today 08:15 AM
Today 05:45 AM
Yesterday 11:09 PM
Yesterday 11:01 PM
Latest FTSE 100 articles
March 11, 2024 04:30 PM
March 5, 2024 12:00 PM
February 12, 2024 10:30 AM
January 15, 2024 12:30 PM