


Asian Indices:
- Australia's ASX 200 index rose by 136.8 points (2%) and currently trades at 6,975.10
- Japan's Nikkei 225 index has risen by 529.94 points (2%) and currently trades at 26,693.55
- Hong Kong's Hang Seng index has fallen by -200.55 points (-0.84%) and currently trades at 23,606.45
- China's A50 Index has fallen by -17.14 points (-0.11%) and currently trades at 15,007.42
UK and Europe:
- UK's FTSE 100 futures are currently up 14.5 points (0.19%), the cash market is currently estimated to open at 7,568.81
- Euro STOXX 50 futures are currently down -1.5 points (-0.04%), the cash market is currently estimated to open at 4,183.47
- Germany's DAX futures are currently down -21 points (-0.14%), the cash market is currently estimated to open at 15,503.27
US Futures:
- DJI futures are currently up 130 points (0.38%)
- S&P 500 futures are currently up 128.25 points (0.92%)
- Nasdaq 100 futures are currently up 20.75 points (0.48%)
Strong earnings from Apple helped to lift US future at the open and serve as a lead for Asian indices to follow. Of course, not all can be attributed to Apple, as dialogue between the US and Russia remains open which has lowered geopolitical tensions somewhat. But there also comes a point where bears book profits and bulls attempt to pick up bargains. And that point appeared to be today in Asia.
Australia’s ASX 200 was a top performer although its rebound stopped short of testing 7,000. The Nikkei is also up around 2% after gapping back above a prior support level. Yet futures markets for Europe are a little mixed whilst US futures have continued higher. With that said, indices in Europe have been singing to their own tune anyway with the FTSE and STOXX 600 rising for three consecutive days whilst their Asian counterparts moved swiftly lower.
The STOXX 600 remains below a key trendline is broken on Monday yet, at current prices, remains on track for a bullish hammer on the weekly chart. We wouldn’t want to see prices breach yesterday’s high too much to keep the bearish bias alive, in which case our targets are the January and October low.
As for the FTSE 100 it has managed to do an imp0ressive 3-day rally back towards 7600. It remains within a bullish channel which was confirmed with a third touch on Monday’s low, so for today’s session the pivotal level to trade around appears to be the 7600 – 7620 zone should prices rise that far.
FTSE 100 trading guide>
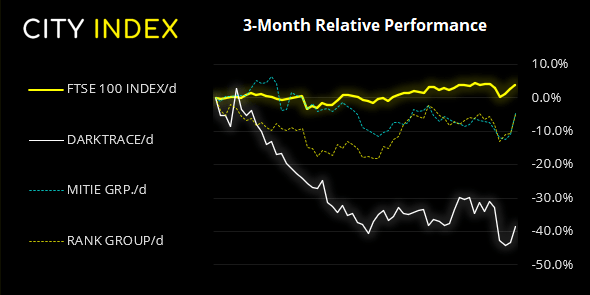
FTSE 350: Market Internals
FTSE 350: 4257.74 (1.13%) 27 January 2022
- 184 (52.42%) stocks advanced and 151 (43.02%) declined
- 9 stocks rose to a new 52-week high, 22 fell to new lows
- 36.18% of stocks closed above their 200-day average
- 100% of stocks closed above their 50-day average
- 13.11% of stocks closed above their 20-day average
Outperformers:
- + 8.20% - Darktrace PLC (DARK.L)
- + 7.22% - Mitie Group PLC (MTO.L)
- + 6.18% - Rank Group PLC (RNK.L)
Underperformers:
- -9.04% - Dr Martens PLC (DOCS.L)
- -8.46% - Man Group PLC (EMG.L)
- -7.47% - Fresnillo PLC (FRES.L)
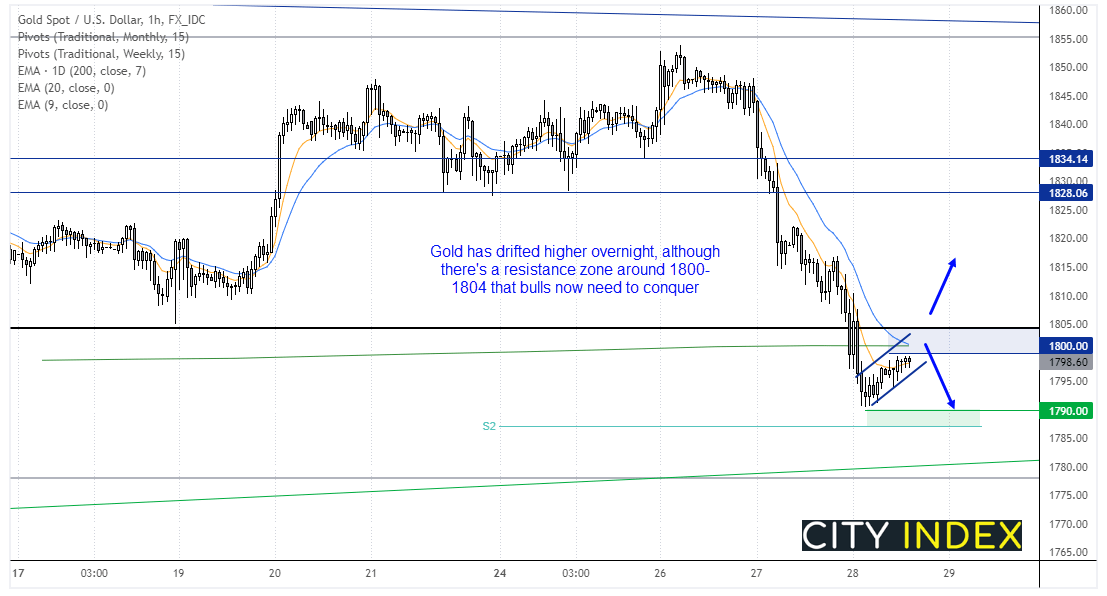
Gold drifts back to 1800
Spot gold prices have fallen around -$58.00 over the past two days (over 3%) over the past two days. Bulls failed to break higher out of a multi-month triangle and now bears are seemingly gunning for the lower trendline around 1785. We can see the momentum is clearly bearish on the hourly chart overall, although prices have drifted higher as part of a potential bear flag pattern. Yet it is headed straight into a resistance zone between 1800 – 1804 which comprises of the 200-day eMA, monthly pivot point and the round number of 1800. It’s a zone if resistance which is likely to attract bearish attention and, if a swing high becomes apparent, bears are then likely to try and drive prices back to the 1790 low and / or the rising trendline around 1785. Our bias remains bearish below 1805, a break above which invalidates the short bias and signals a deeper countertrend move.
EUR/USD sits around its 18-month low
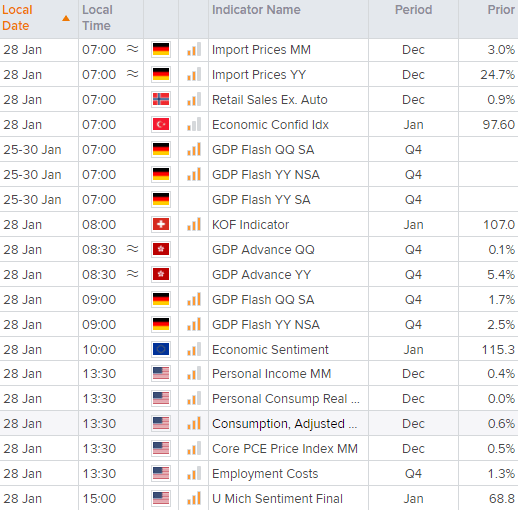
The euro has traded in a miniscule range at the lows of yesterday’s bearish candle, as bulls are just as reluctant to step in as bears are to book profits. Yet we may see some volatility around Germans GDP at 09:00 GMT. Beyond today we now wonder if there are chances of a snap-back from these lows as recent price action has been unusually exciting in terms of one-way volatility. It’s currently down around -1.6% for the week and, in recent history, all weeks that have fallen over -1% have been followed by a bullish week.
Euro explained – a guide to the euro
Up Next (Times in GMT)
How to trade with City Index
You can easily trade with City Index by using these four easy steps:
-
Open an account, or log in if you’re already a customer
• Open an account in the UK
• Open an account in Australia
• Open an account in Singapore
- Search for the company you want to trade in our award-winning platform
- Choose your position and size, and your stop and limit levels
- Place the trade
Latest market news
Today 11:14 AM
Today 08:28 AM
Yesterday 03:30 PM
Yesterday 01:23 PM
Yesterday 11:00 AM
Latest Forex articles

Yesterday 11:00 AM
April 23, 2024 11:09 PM
April 23, 2024 04:00 PM