


Asian Indices:
- Australia's ASX 200 index fell by -39 points (-0.53%) and currently trades at 7,384.90
- Japan's Nikkei 225 index has fallen by -156.95 points (-0.55%) and currently trades at 29,125.11
- Hong Kong's Hang Seng index has fallen by -34.31 points (-0.14%) and currently trades at 24,961.83
- China's A50 Index has risen by 146.11 points (0.95%) and currently trades at 15,505.21
UK and Europe:
- UK's FTSE 100 futures are currently up 3 points (0.04%), the cash market is currently estimated to open at 7,343.15
- Euro STOXX 50 futures are currently down -15.5 points (-0.36%), the cash market is currently estimated to open at 4,333.32
- Germany's DAX futures are currently down -39 points (-0.24%), the cash market is currently estimated to open at 16,028.83
US Futures:
- DJI futures are currently down -112.24 points (-0.31%)
- S&P 500 futures are currently up 26.5 points (0.17%)
- Nasdaq 100 futures are currently up 4.5 points (0.1%)
Indices
An SEC filing confirmed the Elon Musk sold 10% of his Tesla holdings, which amounted to around $1.1 billion. However, the filing also revealed that the sale began in September, before his Twitter poll. So, should Fintwit take that as a form of prediction or hold him to the (non-binding) Twitter agreement of him selling another 10% based on the poll? We’ll assume the former.
Asian markets were mixed as investors absorbed the strong inflation data they were worried about. The China A50 was a top performer, rising around 1% with the Nikkei up around 0.6%. Yet the ASX 200 slumped below 7400 and filled the liquidity gap we flagged before the open.
FTSE futures are pointing towards a relatively flat open and for the cash index to open near yesterday’s highs. A bullish engulfing candle saw it close above 7300 for the first time since February 2020, all thanks to a much weaker pound. Take note of the data dump at 07:00 including Q3 GDP and production output data (and of the resistance cluster around our interim flag target).
FTSE 350: Market Internals
FTSE 350: 4206.3 (0.91%) 10 November 2021
- 216 (61.54%) stocks advanced and 120 (34.19%) declined
- 12 stocks rose to a new 52-week high, 2 fell to new lows
- 62.39% of stocks closed above their 200-day average
- 58.69% of stocks closed above their 50-day average
- 21.08% of stocks closed above their 20-day average
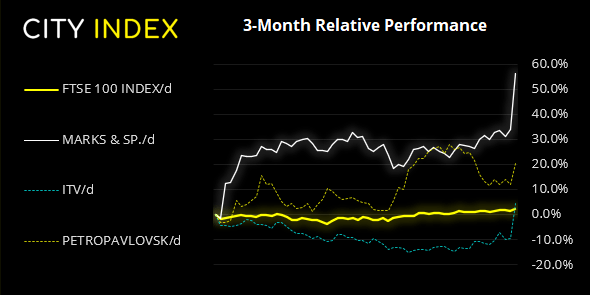
Outperformers:
- + 16.48%-Marks and Spencer Group PLC(MKS.L)
- + 15.14%-ITV PLC(ITV.L)
- + 7.46%-Petropavlovsk PLC(POG.L)
Underperformers:
- -7.24%-J D Wetherspoon PLC(JDW.L)
- -5.76%-Indivior PLC(INDV.L)
- -4.14%-Watches of Switzerland Group PLC(WOSG.L)
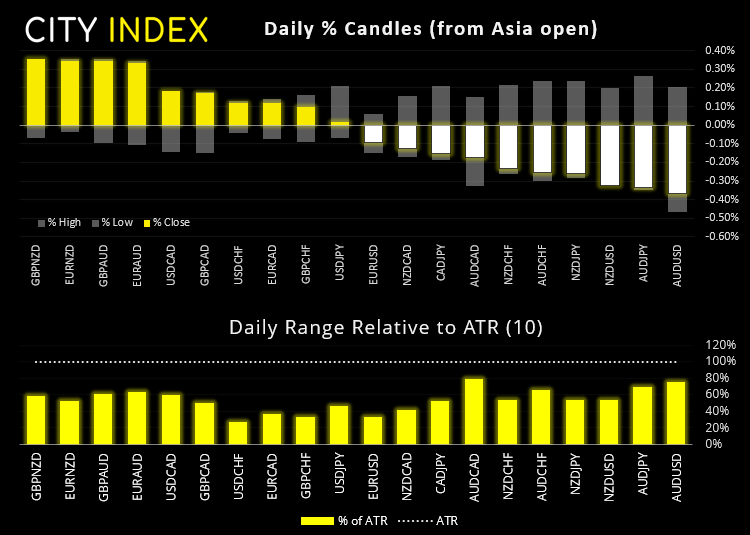
Forex:
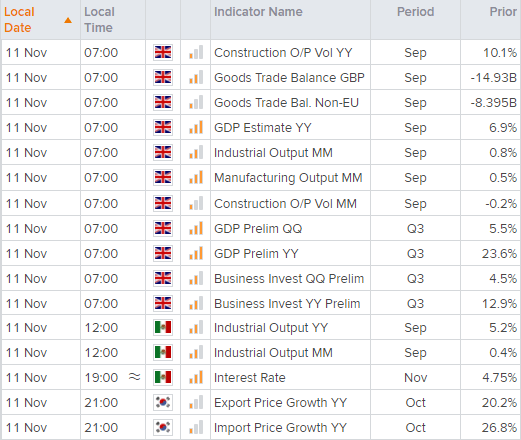
UK data takes the helm at 07:00 with preliminary GDQ for Q3 expected to slip to around 2.5%, down from 5.5% q/q. Whilst it is an important number it is also the one with the largest lag. So traders will assess it alongside the coincident indicators also released such as construction, industrial and manufacturing output. But the business investment component of GDP is forward looking, so a rise here would be a welcomed addition if other data also exceed and could even help support the pound a little. Yet with Brexit woes continuing to cloud the UK’s (and likely BOE’s outlook) then the larger move would likely come form a weak set of reports today.
The Bank of Mexico also announce their interest rate decision at 19:00. Currently sitting at 4.75%, they raised rates by 0.25% at their last meeting and the Deputy Governor said that the hiking cycle is not over and could see 1 or 2 more hikes.
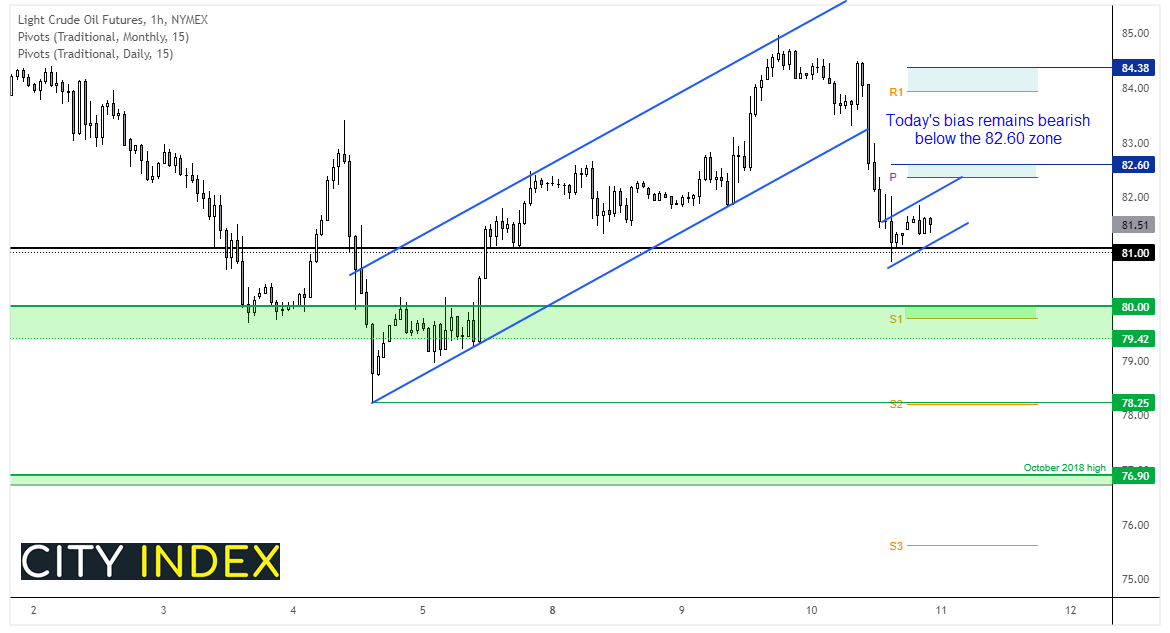
Commodities:
Oil didn’t escape the volatility of strong inflation yesterday. WTI printed a large bearish engulfing candle on the daily chart, after reaching out $85 target. Intraday momentum saw prices break beneath the bullish channel and prices are now holding just above $81.00.
We retain a bearish bias today and would prefer to fade into intraday rallies below the 82.37 – 82.60 area. Take note that the monthly pivot is arounds $81 so, from a reward to risk perspective, bears may want to fade into highs or wait for a break of new lows. As a bearish flag is forming on the hourly chart, perhaps we’ll see a direct break lower and head towards $80, with a break of 79.42 exposing the 78.25 low / daily S2 pivot.
Brent didn’t make it to the 2018 highs, but it did at least tap our initial target at 85.30 before handing back some gains. Yet overnight it has closed the gap with WTI and has since fallen -2 handles and now trades around $82.50.
Up Next (Times in BST)
This content will only appear on City Index websites!
How to trade with City Index
You can trade easily trade with City Index by using these four easy steps:
-
Open an account, or log in if you’re already a customer
• Open an account in the UK
• Open an account in Australia
• Open an account in Singapore
- Search for the company you want to trade in our award-winning platform
- Choose your position and size, and your stop and limit levels
- Place the trade
Latest market news
Yesterday 01:23 PM
Yesterday 06:01 AM
April 18, 2024 11:27 PM
April 18, 2024 04:46 PM
Latest Forex articles
Yesterday 06:01 AM
April 17, 2024 02:40 PM
April 17, 2024 04:47 AM