


Asian Indices:
- Australia's ASX 200 index rose by 18.8 points (0.27%) and currently trades at 7,111.30
- Japan's Nikkei 225 index has fallen by -111.52 points (-0.39%) and currently trades at 28,530.33
- Hong Kong's Hang Seng index has fallen by -87.99 points (-0.3%) and currently trades at 29,078.02
UK and Europe:
- UK's FTSE 100 futures are currently up 4 points (0.06%), the cash market is currently estimated to open at 7,030.93
- Euro STOXX 50 futures are currently up 3 points (0.07%), the cash market is currently estimated to open at 4,034.67
- Germany's DAX futures are currently up 3 points (0.02%), the cash market is currently estimated to open at 15,453.72
Wednesday US Close:
- DJI futures are currently down -31 points (-0.09%), the cash market is currently estimated to open at 34,281.46
- S&P 500 futures are currently down -29 points (-0.21%), the cash market is currently estimated to open at 4,166.99
- Nasdaq 100 futures are currently down -6.25 points (-0.15%), the cash market is currently estimated to open at 13,696.49
Learn how to trade indices
Equities were mixed overnight in Asia, KOSPI 200 and TOPIX falling -0.8% and -0.4% respectively, Japan’s Nikkei 225 was -0.7% lower, the ASX 200 rose 0.2% despite Victoria heading back into lockdown, whilst the CSI300 was up by 0.4%.
Futures markets are pointing to slightly higher open in Europe, and European indices such as DAX and STOXX 50 are just below their record highs. Perhaps they’ll have another crack today but, as we are at levels which has seen the market sell-off twice already this month, we’re also prepared for a little disappointment.
Meanwhile, the FTSE 100 is continuing to coil into a symmetrical triangle formation. Usually, they are assumed to break out in the direction of the underlying trend which would be bullish in this case. Yet if you step back and look at the structure of the daily chart it seems to be a flip of a coin as to whether the trend peaked this month (and still part of a corrective move) or whether that correction was completed just three days later. To further hammer home that the FTSE is in a period of indecision, it printed a Doji yesterday which could well mark the apex of its tringle.
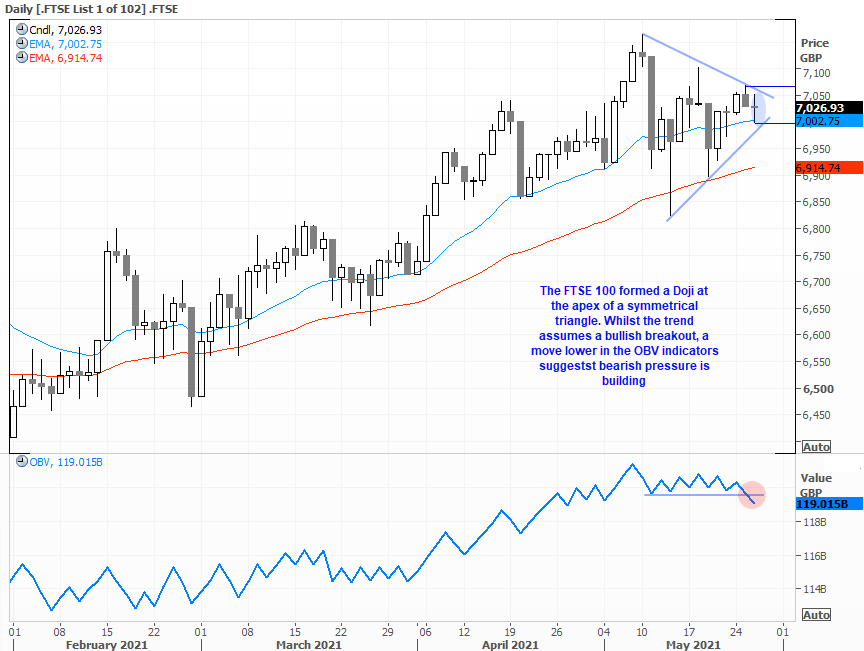
However, what is of interest to a bearish argument is that the OBV (on balance volume) has broken its support line which shows bearish volume is dominating. So perhaps it is tipping its hat towards a bearish breakout.
- A clear break beneath 7000 assumes the bearish breakout is underway (and we’d want to see it coupled with a lower OBV).
- A break above yesterday’s high could confirm a bullish breakout, but we’d want to see that on notably rising volume to fend of the bearish warning from the OBV indicator.
FTSE 350: Market Internals
FTSE 350: 7026.93 (-0.04%) 26 May 2021
- 248 (70.66%) stocks advanced and 89 (25.36%) declined
- 26 stocks rose to a new 52-week high, 3 fell to new lows
- 84.33% of stocks closed above their 200-day average
- 22.22% of stocks closed above their 20-day average
Outperformers:
- + 33.8% - Vectura Group PLC (VEC.L)
- + 8.50% - Marks and Spencer Group PLC (MKS.L)
- + 7.88% - UK Commercial Property REIT Ltd (UKCM.L)
Underperformers:
- -11.7% - C&C Group PLC (GCC.L)
- -5.01% - Intertek Group PLC (ITRK.L)
- -3.81% - Ocado Group PLC (OCDO.L)
Forex: Yuan rises to its highest level in nearly three years
Industrial profits in China were lower in April thanks to higher commodity prices limiting manufacturer’s profits. China are trying to curb the rise of commodities at the domestic level and part of that strategy appears to be letting the yuan appreciate, which has seen USD/CNH fall to its lowest level since June 2018. Now resting at 6.376 support, the trend points lower with the next major support level being 6.3000.
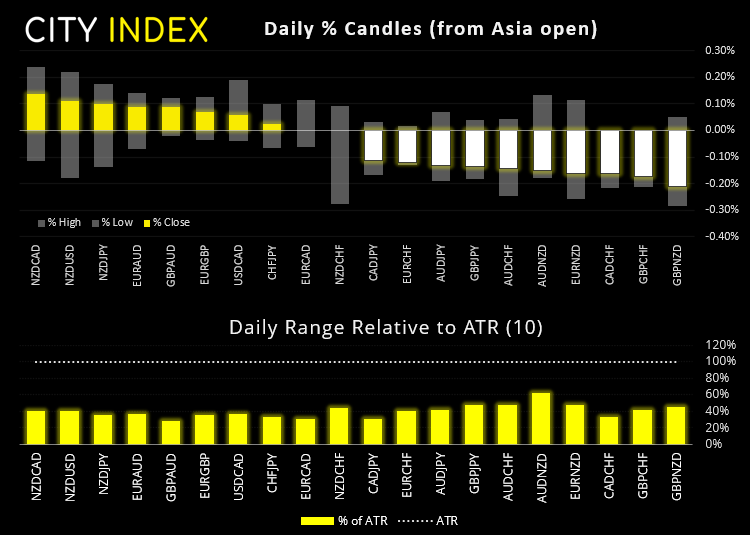
NZD was again the strongest major and remained supported from yesterday’s hawkish RBNZ meeting, although outside of the kiwi dollar volatility was tame to say the least. Emerging markets continued to push higher as the Fed continued to steer inflationary fears away, which saw MSCI’s emerging markets currency index hit a new record high overnight.
EUR/USD produced a bearish engulfing candle yesterday after failing to hold above its breakout level of 1.2243. Whilst this is not ideal for a bullish case on the daily chart over the near-term, the H4 candle is on track for a bullish engulfing / hammer. Perhaps strong consumer sentiment at 07:00 can help bump it up, but on a technical perspective it looks set for a bounce from current levels.
Learn how to trade forex
TIPS suggest gold may be ready to retrace
Yesterday’s bearish pinbar on gold appears more ominous now we note that the TIPS (treasury indexed protected securities) are rising. These can be used as a proxy for real interest rates and are negatively correlated with gold. Should TIP (treasury yields adjusted for inflation) continue to rise them it makes a correction on gold appear the more compelling.
Spot gold is trying to reclaim 1900 ahead of the European open, but another failure to break to a new high today could increasingly suggest that gold may be due a dip lower before its trend resumes.
Up Next (Times in BST)
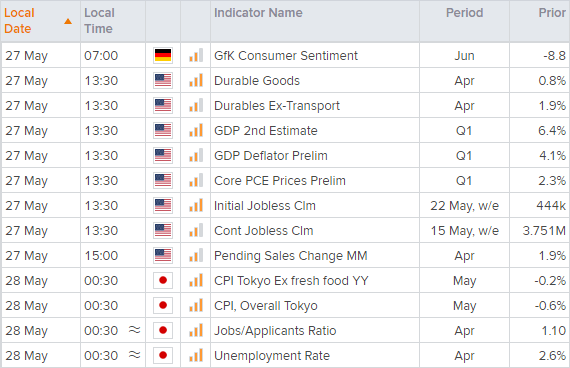
You can view all the scheduled events for today using our economic calendar, and keep up to date with the latest market news and analysis here.
Latest market news
Today 01:15 PM
Today 11:30 AM
Today 08:18 AM
Latest FTSE 100 articles
March 11, 2024 04:30 PM
March 5, 2024 12:00 PM
February 12, 2024 10:30 AM
January 15, 2024 12:30 PM