


Asian Indices:
- Australia's ASX 200 index fell by -55 points (-0.78%) and currently trades at 7,027.30
- Japan's Nikkei 225 index has risen by 62.08 points (0.21%) and currently trades at 29,053.67
- Hong Kong's Hang Seng index has fallen by -449.14 points (-1.53%) and currently trades at 28,854.12
UK and Europe:
- UK's FTSE 100 futures are currently down -10.5 points (-0.15%), the cash market is currently estimated to open at 6,950.98
- Euro STOXX 50 futures are currently down -3 points (-0.08%), the cash market is currently estimated to open at 3,993.90
- Germany's DAX futures are currently down -16 points (-0.11%), the cash market is currently estimated to open at 15,138.20
Thursday US Close:
- The Dow Jones Industrial rose 239.98 points (0.71%) to close at 34,060.36
- The S&P 500 index rose 28.29 points (0.01%) to close at 4,211.47
- The Nasdaq 100 index rose 68.59 points (0.49%) to close at 13,970.21
Is April’s party for Indices over?
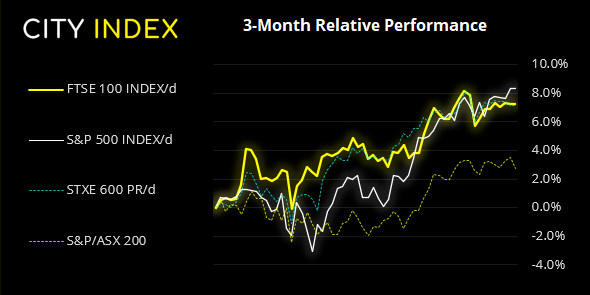
Despite a strong earnings season for Europe, equities were lower by the close with rising yields across the region. The banking sector was firm (thanks to rising yields) but, without any apparent news to trigger for the sell-off, traders are assumed to be booking profits at month end, just ahead of May (a month that has traditionally been a month of underperformance for equity markets).
Indeed, the ASX 200 has followed suit and rolled over from its highs, dragged down by energy stocks, after failing to test 7100. And given that the ASX 200 and FTSE 100 have essentially moved in lockstep over recent times, it does not bode well for today’s session for the bull camp. Oh, and futures markets are mostly pointing lower anyway, so there is that as well.
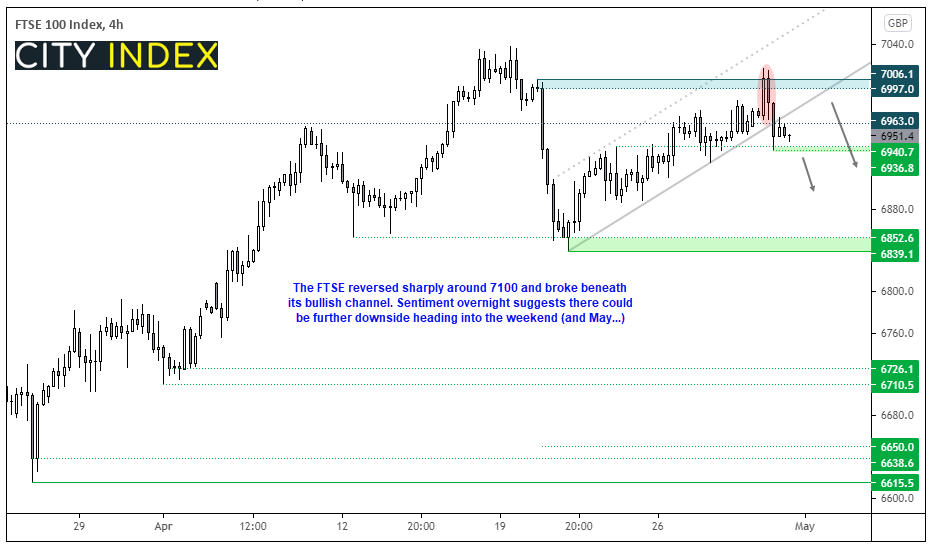
The FTSE 100 printed a bearish pinbar yesterday which failed to hold above 7,000. Given the weak lead overnight and the fact we’re heading into the period of “sell in May and go away”, then it’s hard to not have a bearish view for the FTSE today.
The four-hour chart shows it had broken beneath its bullish channel by the close and is now back beneath its January high. So, unless we see a quick recovery at the open, our bias remains bearish below 6965.
- A break (or gap) below 6936.80 assumes bearish follow-through
- Under this scenario, the bias remains bearish beneath the January high
- Should prices move higher, bears can seek bearish setups along the broken trendline, u towards 7,000
FTSE 350: Market Internals
FTSE 350: 6961.48 (-0.03%) 29 April 2021
- 147 (41.9%) stocks advanced and 192 (54.70%) declined
- 27 stocks rose to a new 52-week high, 6 fell to new lows
- 85.75% of stocks closed above their 200-day average
- 21.65% of stocks closed above their 20-day average
Outperformers
- + 13.1% - Tullow Oil PLC (TLW.L)
- + 5.63% - Standard Chartered PLC (STAN.L)
- + 5.59% - Smith & Nephew PLC (SN.L)
Underperformers:
- -4.21% - Morgan Advanced Materials PLC (MGAMM.L)
- -4.09% - 888 Holdings PLC (888.L)
- -3.79% - Restaurant Group PLC (RTN.L)
AstraZeneca (AZN.L) and Barclays (BARC.L) release earnings ahead of the open at 07:00 and Pearson PLC (PSON.L) hold their annual shareholders meeting at 12:00.
Learn how to trade indices
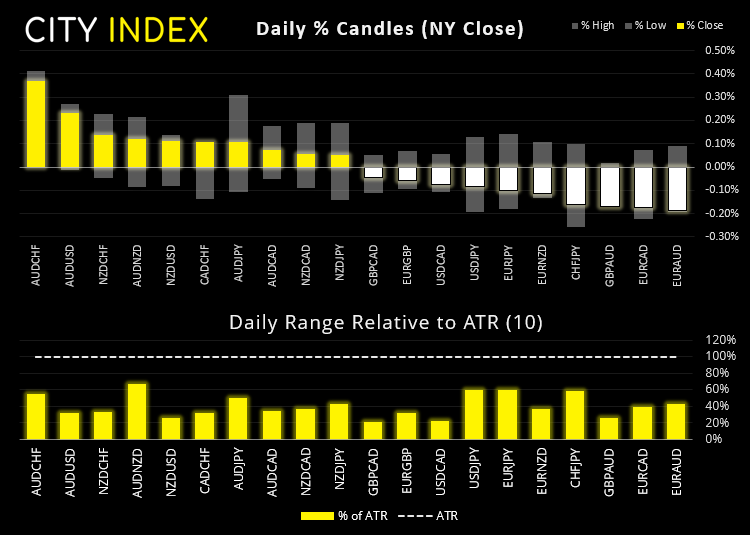
Forex: Mixed China data, Commodity FX leads the pack
Commodity currencies are slightly firmer overnight, with the Australian dollar in the lead. Whilst the official PMI data from China was softer and below expectations, the Caixin final PMI read was revised higher, which takes the edge off of the slightly disappointing PMI earlier in the session.
- This saw AUD/CHF and AUD/USD lead the pack higher, although volatility was capped overall (which leaves plenty of meat on the bone for today’s European and US sessions).
- EUR/GBP is holding above 0.8672 support and trading in a tight consolidation. This may be one for next week but a break above 0.8731 could assume bullish continuation.
- EUR/USD produced a Rikshaw Man Doji (indecision candle) at 1.2150 resistance. It wouldn’t be far-fetched to suspect its upside may be limited over the near-term or, dare we say, retrace lower from current levels.
Learn how to trade forex
Gold and silver to consolidate above support for now?
Gold and silver are slightly lower after printing bearish outside candles yesterday. Yet despite their little tantrums, both markets are holding above support zones. Silver found support at its 50-day eMA and 25.44/61 zone whilst gold also found support at its 50-day eMA and 1760/64 zone. Our core views remains bullish, but the dollar’s downside is looking stretched, so perhaps these moves need a bit of a pause before resuming (hopefully by next week).
Up Next (Times in BST)
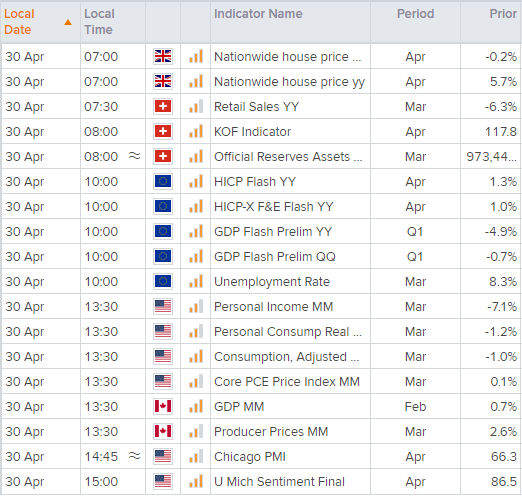
You can view all the scheduled events for today using our economic calendar, and keep up to date with the latest market news and analysis here
Latest market news
Today 11:14 AM
Today 08:28 AM
Yesterday 03:30 PM
Latest FTSE 100 articles
March 11, 2024 04:30 PM
March 5, 2024 12:00 PM
February 12, 2024 10:30 AM
January 15, 2024 12:30 PM