


Asian Indices:
- Australia's ASX 200 index rose by 33.4 points (0.5%) to close at 6,778.80
- Japan's Nikkei 225 index has fallen by -498.92 points (-1.72%) and currently trades at 28,497.00
- Hong Kong's Hang Seng index has fallen by -636.05 points (-2.23%) and currently trades at 27,861.33
UK and Europe:
- UK's FTSE 100 futures are currently down -39 points (-0.59%), the cash market is currently estimated to open at 6,660.19
- Euro STOXX 50 futures are currently down -23 points (-0.61%), the cash market is currently estimated to open at 3,804.02
- Germany's DAX futures are currently down -88 points (-0.6%), the cash market is currently estimated to open at 14,574.02
Tuesday US Close:
- The Dow Jones Industrial fell -308.05 points (-0.94%) to close at 32,731.20
- The S&P 500 index fell -30.07 points (-0.77%) to close at 3,910.52
- The Nasdaq 100 index fell -68.72 points (-0.53%) to close at 13,017.79
Equities point lower following Powell and Yellen’s testimonies
During yesterday’s testimony, Fed Chair Jerome Powell reiterated his dovish views and downplayed any fears of inflation. Then Janet Yellen fielded questions and defended the likely outcome that taxes would need to be raised to paid once the economy is in a stronger position. And what was enough to weigh on Wall Street yesterday was enough to weigh on sentiment in Asia today.
Most major stock market indices across the Asia region are in the red, led by Hong Kong, Japan and China. The ASX 200 bucked the bearish trend and closed 0.5% Higher. Had it not been for the energy sector (the weakest on the ASX 200 today) then perhaps it could be been closer to 1%, but instead healthcare and consumer sectors had to do the heavy lifting.
Futures markets point to a lower open for the FTE 100, which is currently estimated to be around 6660. As this is just above Monday’s low then we’ll be monitoring prices around the open to see if there is appetite to push it lower and test 6600 and break lower. However, should the low hold and prices rally later, a break above the 6700 region will see the index back above its 10-day eMA and confirm two bullish hammers on the daily chart.
PMI data kicks off in Asia
Preliminary Purchase Manager Indices (PMI’s) started on a firmer footing for Australia and Japan today. And with any luck this could bode well for PMI reports due out across Europe and the UK today, as they do have a tendency (although not always) to move in lockstep.
Australia’s composite PMI, which combines the service and manufacturing sector rose to a healthy 56.2, up from 54.4 previously. A reading above 50 denotes expansion.
Japan’s manufacturing PMI rose to 52 in March, its highest levels since December 2018, making it the second expansive print since April 2019. A notable takeaway is the rise of input prices for manufacturer’s and raises the question as to whether this will translate to higher consumer prices further down the track. But it is good to see the headline figure supported by growing output and new orders.
GBP/USD traders seek a divergent PMI theme
As cable broke beneath key support yesterday ahead of a UK data dump and PMI reports for the UK and US, it would be rude not to check out GBP/USD.
Ultimately, traders want to see a clear divergent theme between two economic data sets to produce a clearer and more directional move. A desirable and simplistic outcome is for weak UK data and strong US data to push cable lower (in line with the current four-hour trend), or push it higher with strong UK data and weak US data.
Although technically we would prefer to see a pullback towards the 1.3759/76 resistance zone before rolling over once more. Perhaps net-positive (but not amazing) UK data set could help it retrace towards resistance before a strong US data sets knocks it lower? Only time will tell, but it’s a plan to consider if fundamentals align with the technicals.
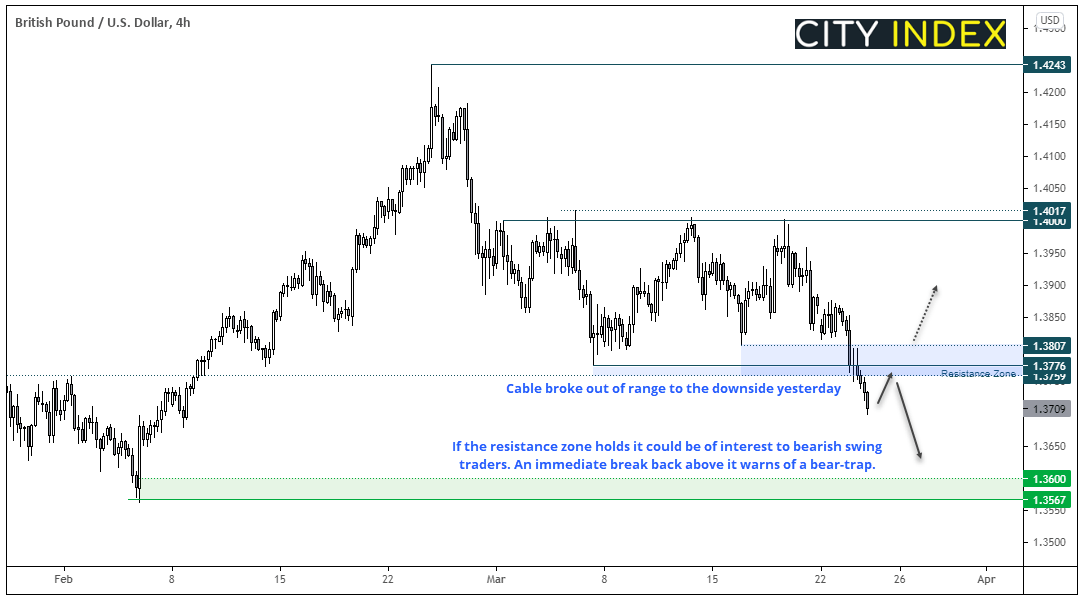
- Our bias is bearish whilst prices hold beneath the 1.3759/76 resistance zone and for an eventual move back towards the 1.3567 – 1.3600 zone.
- In an ideal scenario, prices could retrace towards the resistance zone and form a swing high. However, if the data stacks up against the pound then it may result in a direct move lower.
- A strong break back above 1.3776 warns that yesterday’s break lower was a beartrap. Whilst this takes it back within range we’d want to see if the 1.3776 – 1.3807 zone holds as support before reconsidering longs within the range.
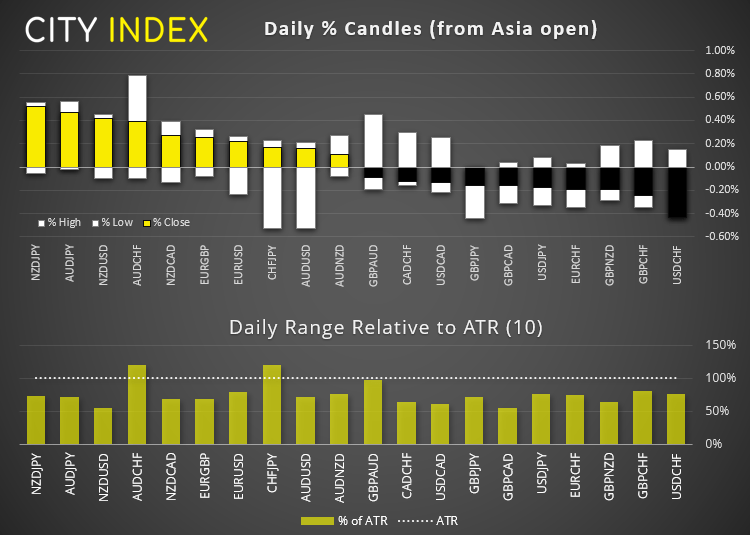
GBP overtakes NZD as the weakest FX major (for now)
GBP, NZD and AUD were the weakest majors overnight and, outside of these pairs, ranges were relatively tight. EUR/NZD and EUR/AUD were the strongest pairs whilst GBP/JPY and NZD/USD were the weakest.
Heading into today’s UK data dump, EUR/GBP is probing yesterday’s highs just beneath 0.8654 resistance. Until it breaks to the upside, the cross remains at levels which is likely to tempt bears. Yet a break above this level brings the 0.8700 handle into focus where the 50-day eMA resides.
GBP/JPY has moved to a three-week low and its intraday trend points lower. Its next level of support is just above 148.00, which leaves around 80 pips of downside potential should data be on the soft side.
NZD/USD extended its lows but the lack of bearish follow-through should serve as a warning to bears heading into the European session.
Commodities:
Gold has drifted higher overnight and currently trades around 1730. But a bearish engulfing (and outside candle) on the four-hour chart yesterday suggests gold is trying to break lower from a symmetrical triangle. Our bias remains bearish below that candles high at 1742.54.
WTI closed beneath its 50-day eMA and 59.24 support yesterday, after shedding over -6%. Currently trading just off yesterday’s lows our near-term bias remains bearish below 59.24.
Palladium has printed three consecutive bearish days following an aggressive bullish breakout last week. We remain on guard for any signs bullish momentum is attempting to realign with the bullish breakout. Out bias remains bullish above 2514 and a break above 2675 (a bullish pinbar high) would be constructive to the bullish case.
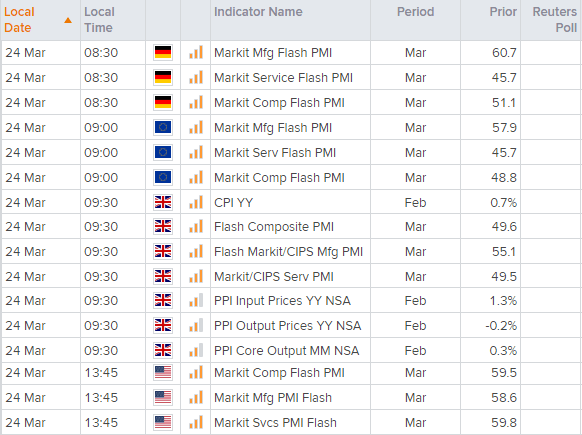
Up Next (Times in GMT)
You can view all the scheduled events for today using our economic calendar, and keep up to date with the latest market news and analysis here.
Today’s calendar speaks for itself. A host of UK data puts GBP pairs and the FTSE 100 into focus. PMI figures are also released across Europe and the US and, as they are preliminary releases (also referred to as ‘flash’ reports) they can generate higher levels of volatility due to ‘leading’ nature of them regarding economic activity.
Latest market news
Yesterday 03:00 PM
Yesterday 01:12 PM
Yesterday 11:14 AM
Latest Equities articles
April 12, 2024 02:28 AM
April 7, 2024 08:46 PM
March 31, 2024 11:22 AM
