


Asian Indices:
- Australia's ASX 200 index rose by 23.5 points (0.32%) and currently trades at 7,326.00
- Japan's Nikkei 225 index has risen by 96.86 points (0.31%) and currently trades at 28,831.27
- Hong Kong's Hang Seng index has risen by 112.12 points (0.39%) and currently trades at 28,851.00
UK and Europe:
- UK's FTSE 100 futures are currently up 12.5 points (0.18%), the cash market is currently estimated to open at 7,100.68
- Euro STOXX 50 futures are currently up 8 points (0.2%), the cash market is currently estimated to open at 4,104.07
- Germany's DAX futures are currently up 15 points (0.1%), the cash market is currently estimated to open at 15,586.22
US Futures:
- DJI futures are currently up 19.1 points (0.06%)
- S&P 500 futures are currently up 18.25 points (0.13%)
- Nasdaq 100 futures are currently up 2.75 points (0.06%)
Learn how to trade indices
FTSE to Open Higher
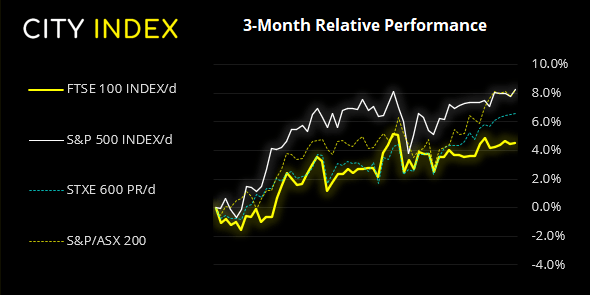
Asian shares were broadly higher with MSCI’s APAC (ex-Japan) index rising 0.2% overnight, taking a positive lead from Wall Street. US yields also continued to soften and fell toa three-month low, after stronger-than expected inflation saw bond bears cover and push yields lower.
Futures markets have opened higher, with FTE 100 futures rising 0.18% and suggesting another challenge on the 7100 handle. However, the cash index is on track for a double-dose of indecision this week, with a Spinning top Doji and inside candle forming on the weekly chart. Two bearish hammers have tried (and failed) to break last week’s high, and the past three sessions have produced selling tails and one buying tail, whilst closing in a 15-point range.
We hope this means it is building up to a large move, but it could just be that time of the year. Although that also serves as a reminder that the FTSE 100 has closed lower 70% of the time in June over the past thirsty years. But over the near-term it remains an index to remain nimble with and open to two-way trade.
FTSE 100 S/R Levels
- R4: 7117.74 - 7120
- R3: 7108
- R2: 7100 – 7101.50
- R1: 7090
- S1: 7080
- S2: 7060
- S3: 7046
- S4: 7040
FTSE 350: Market Internals
FTSE 350: 7088.18 (0.10%) 10 June 2021
- 105 (29.91%) stocks advanced and 225 (64.10%) declined
- 25 stocks rose to a new 52-week high, 1 fell to new lows
- 85.19% of stocks closed above their 200-day average
- 21.94% of stocks closed above their 20-day average
Outperformers:
- + 6.55% - BT Group PLC (BT.L)
- + 6.54% - Auto Trader Group PLC (AUTOA.L)
- + 5.86% - Mitie Group PLC (MTO.L)
Underperformers:
- -5.93% - Aston Martin Lagonda Global Holdings PLC (AML.L)
- -4.59% - Restaurant Group PLC (RTN.L)
- -4.09% - RHI Magnesita NV (RHIM.VI)
Forex: GBP pairs remain firm ahead of UK data
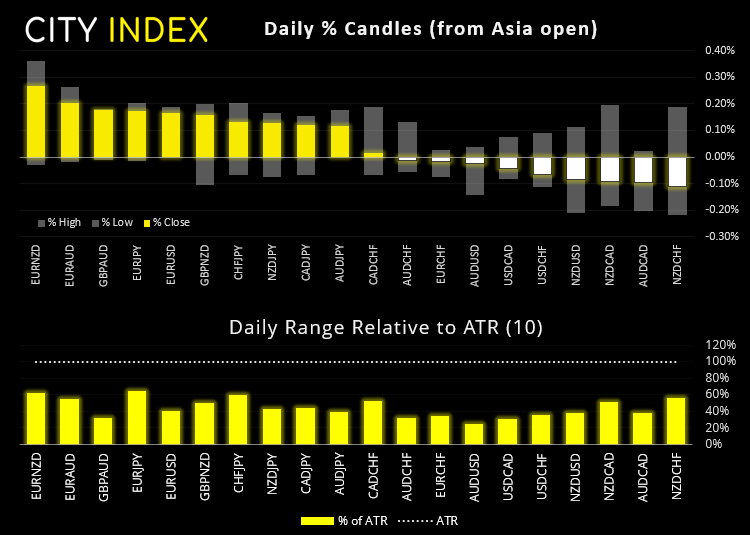
Over the past week the Swiss franc has been the best performer. Whilst it attracted safe-haven flows heading into the ECB meeting and US inflation report, it’s interesting to see it has mostly held onto those gains. At the other end of the spectrum is the New Zealand and Canadian dollar which have both come under pressure thanks to lower oil prices.
EUR and CHF are currently the strongest majors, simply because they’re retracing some of their losses from yesterday. Thin ranges elsewhere with AUD rising just 0.07% and JPY currently down -0.7%.
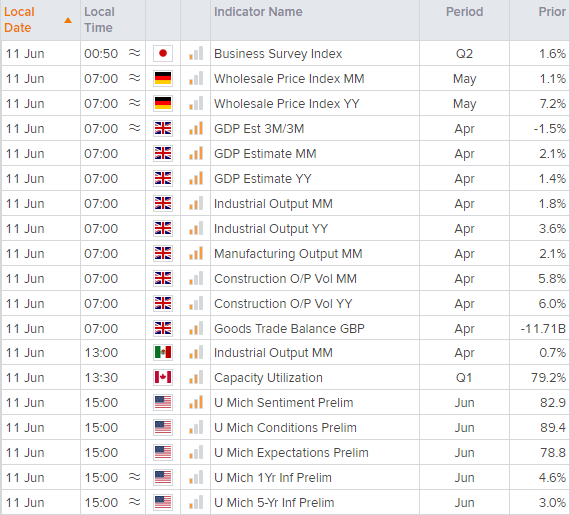
A UK data dump kicks off the European session at 07:00, so GBP pairs and the FTE will be in focus for intraday traders. The pound produced a bullish outside day against USD and EUR, although prices have retraced a little overnight.
We’re looking at GBP/JPY again ahead of the data, in hope that a broadly stronger-than-expected dataset can push the pair above resistance. We had hoped the low was in earlier this week yet bears took one more dip lower yesterday, before producing a bullish Doji which rebounded and closed above the 20-day eMA. Its daily trend is firmly bullish overall, and a large bullish H4 candle show bulls are hoping to take back control. And if they can break above Wednesday’s high (155.32) then perhaps they may have succeeded in realigning momentum with its bullish trend.
Learn how to trade forex
Commodities: Gold hovers around 1900
Gold is trying to break back above 1900 (which would also see it break trend resistance). As outlined in today’s video, we’re monitoring it for either a break higher, or for prices to reverse as part of a symmetrical triangle into next week.
It was a volatile session for oil yesterday, which produced an outside candle in form of an elongated hammer. A break of its low (68.66) confirms it as a bearish reversal, whilst a break of its high assumes a bullish hammer. If volatility is subdued today then it may be one for range traders within yesterday’s range.
Up Next (Times in BST)
Latest market news
Yesterday 01:23 PM
Yesterday 06:01 AM
April 18, 2024 11:27 PM
April 18, 2024 04:46 PM
Latest FTSE 100 articles
March 11, 2024 04:30 PM
March 5, 2024 12:00 PM
February 12, 2024 10:30 AM
January 15, 2024 12:30 PM