
Asian Indices:
- Australia's ASX 200 index rose by 29.9 points (0.41%) and currently trades at 7,295.50
- Japan's Nikkei 225 index has fallen by -294.51 points (-1.02%) and currently trades at 28,751.34
- Hong Kong's Hang Seng index has fallen by -462.59 points (-1.6%) and currently trades at 28,365.36
UK and Europe:
- UK's FTSE 100 futures are currently up 25.5 points (0.36%), the cash market is currently estimated to open at 7,150.66
- Euro STOXX 50 futures are currently up 14 points (0.34%), the cash market is currently estimated to open at 4,092.89
- Germany's DAX futures are currently up 36 points (0.23%), the cash market is currently estimated to open at 15,639.81
US Futures:
- DJI futures are currently up 131.02 points (0.38%)
- S&P 500 futures are currently down -21.75 points (-0.15%)
- Nasdaq 100 futures are currently up 2.5 points (0.06%)
Learn how to trade indices
Indices: FTSE rallies back above its 50-day eMA (yet again)
China’s CSI 300 was the weakest major benchmark overnight, falling -2.4% the day after the CCP celebrated its centenary – all sectors are currently in the red. At the other end of the scale, Japanese equities rose to snap a four-day losing streak as a weaker yen lifted automaker and manufacturing stocks. Elsewhere, volatility remain capped and equity performance was mixed. US futures markets have opened relatively flat and European futures are a touch higher.
Once again, the 50-day eMA comes to the rescue for FTSE 100 bulls. Wednesday produce the fifth consecutive false intraday break below the 50-day eMA, only to see prices rally the next day (six if we include the Feb 26th which closed beneath it yet rallied the following day regardless). Closing to a 5-day high and rebounding above 7,000 and the 50-day eMA, the FTSE goes into this session on the front foot with support around 7090/95 (10-20 day eMA’s and yesterday’s POC). As things stand, the index is on track for a bullish pinbar week and a break above 7140 will only make it appear the more bullish for next week. A break below 7070 would quickly change our near-term bullish view over.
FTSE 350: Market Internals

FTSE 350: 4079.21 (1.25%) 01 July 2021
- 301 (85.75%) stocks advanced and 41 (11.68%) declined
- 15 stocks rose to a new 52-week high, 1 fell to new lows
- 82.91% of stocks closed above their 200-day average
- 56.41% of stocks closed above their 50-day average
- 13.96% of stocks closed above their 20-day average
Outperformers:
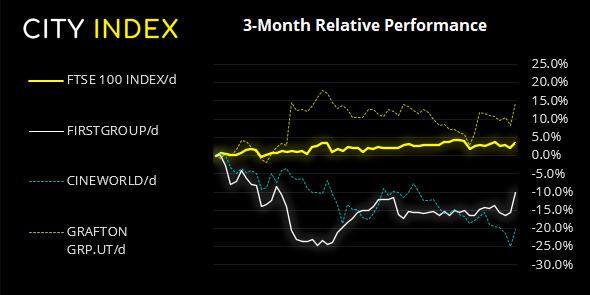
- + 6.72% - FirstGroup PLC (FGP.L)
- + 6.30% - Cineworld Group PLC (CINE.L)
- + 5.93% - Grafton Group PLC (GFTU.L)
Underperformers:
- -14.79% - Micro Focus International PLC (MCRO.L)
- -4.03% - AO World PLC (AO.L)
- -3.88% - Essentra PLC (ESNT.L)
Forex: Clear lines in the sand for FX majors ahead of NFP
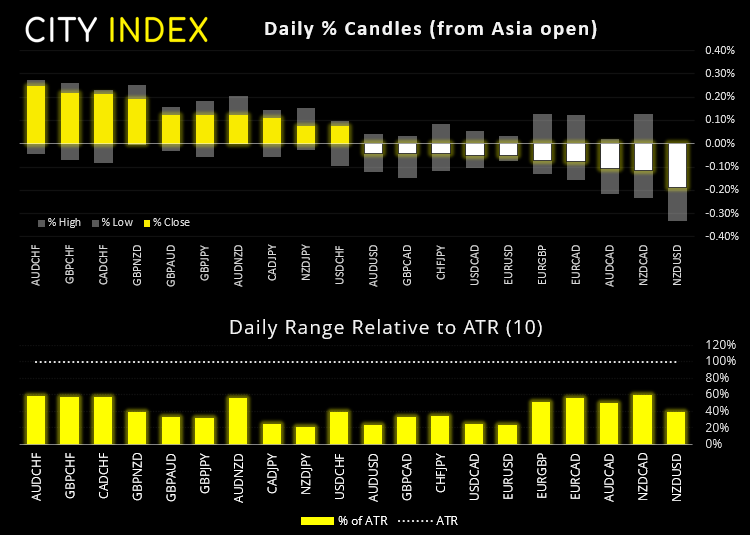
It was razor thin range for currency pairs overnight, which makes the British pound the ‘strongest’ major at a whopping 0.1% higher. The US dollar is the strongest currency over the past week, with AUD and NZD falling the most against it by -1.6% and -1.4% respectively. The US dollar index (DXY) is on track to hit the initial gap resistance target around 92.80, with next resistance residing around 93.00 and 93.20.
USD/JPY remains a go-to pair for NFP, and the pandemic March 2020 high is the key level to watch. USD/CHF is also a good one to watch, and a break below 0.9233 assumes something has gone wrong for bulls, so we’d favour dips above that level. 0.9279 and 0.9300 are the next resistance level for bulls to conquer. EUR/USD remain anchored to its June, which is the clear line in the sand for today’s employment report. GBP/USD closed beneath the 1.3787 low yesterday, so a level for bears to fade into upon a strong report or capitulate should it disappoint.

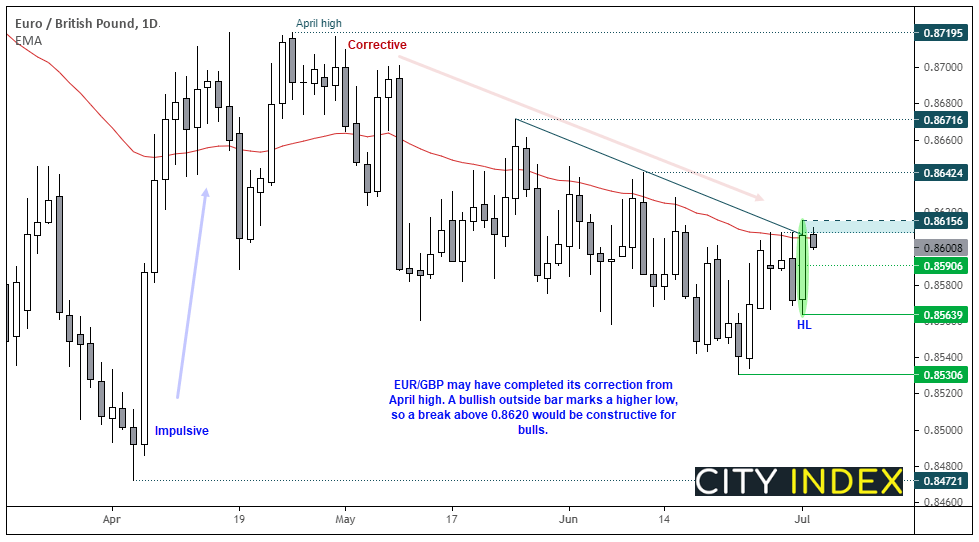
With the trading community embroiled over Nonfarm payroll, we feel inclined to look at something relatively uncorrelated to it. Thankfully, an interesting setup appears to be forming on EUR/GBP. Price action has been trading in a corrective fashion since the April high, and the prior move into that high was a strong, bullish move. Yesterday’s bullish outside candle probed trendline resistance and tested the 50-day eMA and suggest a higher low has formed (and that the corrective low from the April high has been seen at 0.8530). Ultimately, we think EUR/GBP is trying to break high, so our bias remains bullish above yesterday’s low (0.8564) and a break above yesterday’s high (0.8615) assume bullish continuation. It would be a bonus if any low volatility retracements hold above the pivotal level of 0.8590.
Learn how to trade forex
Commodities:
Gold is on track for a bullish hammer this week. We’d need to see a break above 1800 before getting too bullish but, over the near-term, we see potential for further upside over the near-term. A break above 1783 brings 17900 and 1794 into focus (the latter being a swing high and weekly R1 pivot).
Copper futures produced a bearish engulfing candle yesterday. The daily chart has shows three tests of 4.340 resistance and prices remains beneath the 20 and 50-day eMA (which produced a bearish cross six days ago). Given the trend lower in net-log exposure then it is still a possibility to see another leg lower. Obviously, the US dollar plays a key part in all of this, so if ere to see a disappointing print (lower dollar) then resistance may well come under attack again.
Brent futures are holding above the April 2019 high (75.58) after yesterday’s OPEC+ meeting which suggests support resides around 75.35. It’s not impossible to see a disappointing NFP and that could weaken the dollar and support oil prices, and oil long would be preferred given the established uptrend.
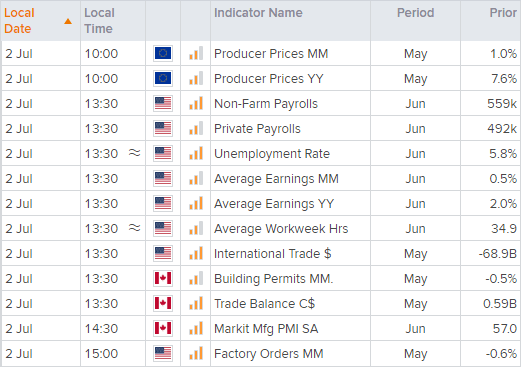
Up Next (Times in BST)

You can view all the scheduled events for today using our economic calendar, and keep up to date with the latest market news and analysis here.
How to trade with City Index
Follow these easy steps to start trading with City Index today:
- Open a City Index account, or log-in if you’re already a customer.
- Search for the market you want to trade in our award-winning platform.
- Choose your position and size, and your stop and limit levels.
- Place the trade.


