


Asian Indices:
- Australia's ASX 200 index fell by -0.2 points (0%) to close at 6,713.90
- Japan's Nikkei 225 index has risen by 172.49 points (0.59%) and currently trades at 28,864.32
- Hong Kong's Hang Seng index has risen by 441.39 points (1.53%) and currently trades at 29,348.91
UK and Europe:
- UK's FTSE 100 futures are currently up 24 points (0.36%), the cash market is currently estimated to open at 6,749.60
- Euro STOXX 50 futures are currently up 9 points (0.24%), the cash market is currently estimated to open at 3,828.92
- Germany's DAX futures are currently up 47 points (0.32%), the cash market is currently estimated to open at 14,587.25
Wednesday US Close:
- The Dow Jones Industrial rose 464.28 points (1.46%) to close at 32,297.02
- The S&P 500 index rose 23.37 points (0.61%) to close at 3,898.81
- The Nasdaq 100 index fell -42.42 points (-0.33%) to close at 12,752.07
It was the usual ‘pre-central bank meeting day’, as volatility was a shadow of its former self for indices. But news that Biden’s COVID-19 stimulus package saw indices track higher in the second half of the session.
Asian indices were led higher by South Korea’s Kospi 200 and China’s CSI 300 index. The ASX 200 was flat for the session and remains around 6,700 after probing a 5-week low. The Nikkei 225 was also flat and remains anchored around 29k, looking for its next directional move.
Index futures are broadly higher across all regions. Nasdaq 100 E-minis led the US higher, currently trading around 91.5 points (0.7%) and the S&P E-minis have risen 18.25 points (0.5%).
S&P 500 cash at the close: 10 March 2021
- The index closed -1.31% below its 52-week high
- 287 (56.83%) stocks advanced and 215 (42.57%) declined
- Energy (2.6%) was the strongest sector and Information Technology (-0.4%) was the weakest
- 7 out of the 11 sectors outperformed the index
- 83.76% of stocks closed above their 200-day average
- 93.86% of stocks closed above their 50-day average
- 73.27% of stocks closed above their 20-day average
Biden chalks up major victory with COVID-19 bill
The Biden administration are enjoying the confirmation of one of the largest economic stimulus packages in US history. All $1.9 trillion dollars of it. $400 billion of it is earmarked for $1,400 direct payments to most Americans, whilst local governments, state aid, child tax credit and further funding for vaccine distribution will receive around $350 billion. President Biden is to address the nation later today, which is presumably to confirm the ‘big Biden bill’.
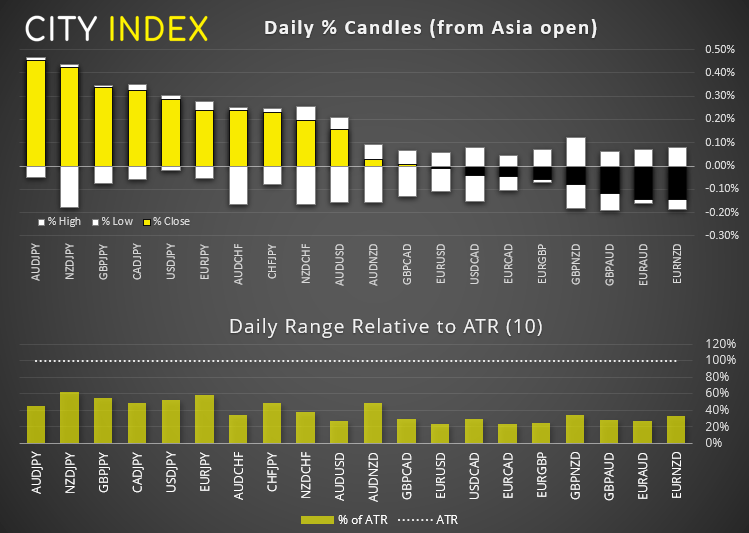
Forex: Tiny overnight ranges leaves plenty of room for range expansion today
As to be expected, all pairs ranges remained well below their ATR’s (average true ranges). The Japanese yen was weaker during a mild risk-on session and the best performers were AUD/JPY, NZD/JPY and GBP/JPY. EUR/NZD and EUR/AUD were the weakest.
- GBP/USD sits just above yesterday’s high, considering a re-test of 1.4000 (currently at 1.3937). Given the 3-day bullish reversal pattern above the 50-day eMA (morning star reversal) we suspect the correction is complete.
- EUR/GBP is around 20-pips above its February low. With no obvious technical levels of support traders can seek support around the 0.8500 handle but, if momentum turns higher then the bullish target is 0.8596.
- EUR/JPY has just broken out of a symmetrical triangle on the hourly chart. The 129.97 (call it 130) high is the next target. The triangle projects an approximate target around 131.00.
- EUR/USD’s bullish candle yesterday was on high volume, particularly with buyers around 1.1900. We remain bullish above this level heading into the ECB meeting but a break below it could see yesterday’s buyers ‘selling’ their holdings to drive prices lower.
EUR/JPY: 131, here we come?
EUR/JPY has just broken out of a symmetrical triangle pattern on the four-hour chart ahead of today’s ECB meeting.
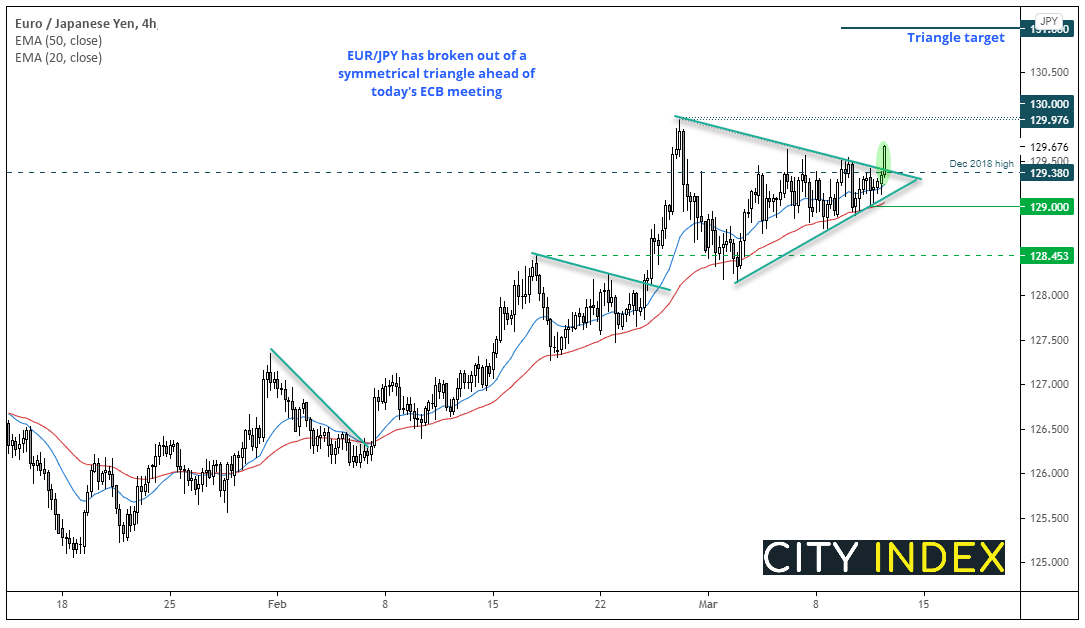
The trend is clearly bullish and the 20 and 50-bar eMAs have provided dynamic support throughout the trend. The breakout has also sent prices back above the December 2018 high. If successful, the triangle projects a target around 131.00.
- Our near-term bias is bullish above 129.38 (triangle breakout and Dec 2018 high)
- For longer time-frame traders, the 129 low can be used for risk management
- We may find profit taking / retracement initially around 130 but, given the overall trend, the bias is for a run to 131.00.
Commodities: Metals drift higher overnight
Gold prices have moved higher overnight and now trades around 1734 at a 5-day high. Silver is also attempting to break above a cluster of averages (10, 20 and 50 eMA’s) between 26.14 – 26.39 and Platinum rose to an 8-day higher overnight, after the Asian session low respected the 10 and 20-day averages as support.
Oil prices have gapped slightly higher after WTI and Brent both found support at their 10-day eMA’s yesterday. WTI trades just below $65 and hints that its small correction could be over with a small bullish candle at support yesterday. Brent currently trades around 68.44.
Up Next (Times in GMT)
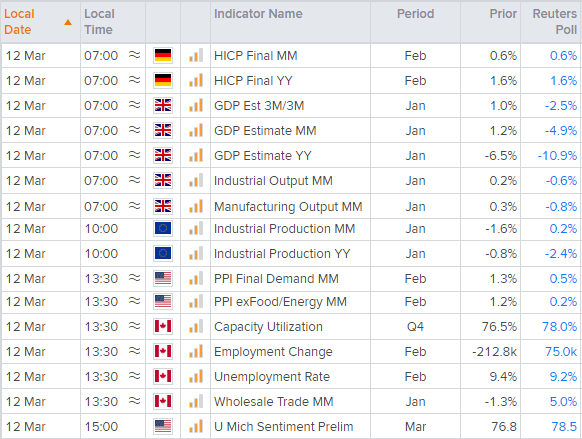
You can view all the scheduled events for today using our economic calendar, and keep up to date with the latest market news and analysis here.
Latest market news
Yesterday 11:09 PM
Yesterday 11:01 PM
Yesterday 04:00 PM
Yesterday 01:15 PM
Yesterday 11:30 AM
Latest Indices articles
April 18, 2024 04:46 PM
April 17, 2024 11:00 AM
April 16, 2024 08:00 PM
April 16, 2024 04:54 PM