


Investors are buying shares through gritted teeth as the ‘hated rally’ grinds higher.
Even with major U.S. stock indices having inched to incremental new records on Wednesday, signs betraying a lack of conviction remain.
Assets traditionally associated with ‘safety seeking’ are rallying simultaneously with stocks. Usually, that would be a caution for risk appetite
- Gold’s bull run has been well documented, including here and here and here. Spot gold was headed for its seventh straight weekly advance at last check, the longest winning streak in around 8 years. Silver is also now showing signs of joining the precious metals rally
- Global sovereign bonds are continuing a remarkable months-long march that’s crushing yields. On Thursday, Germany’s 10-year bund yield went below the ECB’s minus 0.4% deposit rate for the first time, after trading mostly below zero since March. Italy’s 2-year yield, one of the most elevated and unstable among developed countries, also went sub-zero
- In currencies the yen and the Swiss franc have headed higher since late April. Both have added around 4% since then
One obvious question is ‘how long can this simultaneous rally last’? Whilst a definitive answer may be difficult to give, stocks’ positive reaction too cooling trade tensions offers indirect clues. If attempts by the U.S. and China to resume talks fall apart again, the suggestion is that stock markets could unravel too.
Maybe markets are subtly pulling back from ‘risk’ already. Although stock markets have been rallying alongside assets perceived to be safer, the breakdown shows defensive sectors are increasingly favoured. Admittedly, the bid for such stocks hasn’t been easy to spot. Finer graphic tools like the Relative Rotation Graph can help. RRG plots returns around two axis which create four quadrants named (clockwise from top left) ‘improving’, ‘leading’, ‘lagging’ and ‘weakening’. Stocks or sector index performance are plotted relative to a benchmark. In the RRG below, the reference gauge is Europe’s STOXX 600.
Relative Rotation Graph – STOXX Europe 600 sector indices - 12 weeks ending [04/07/2019 17:54:00]
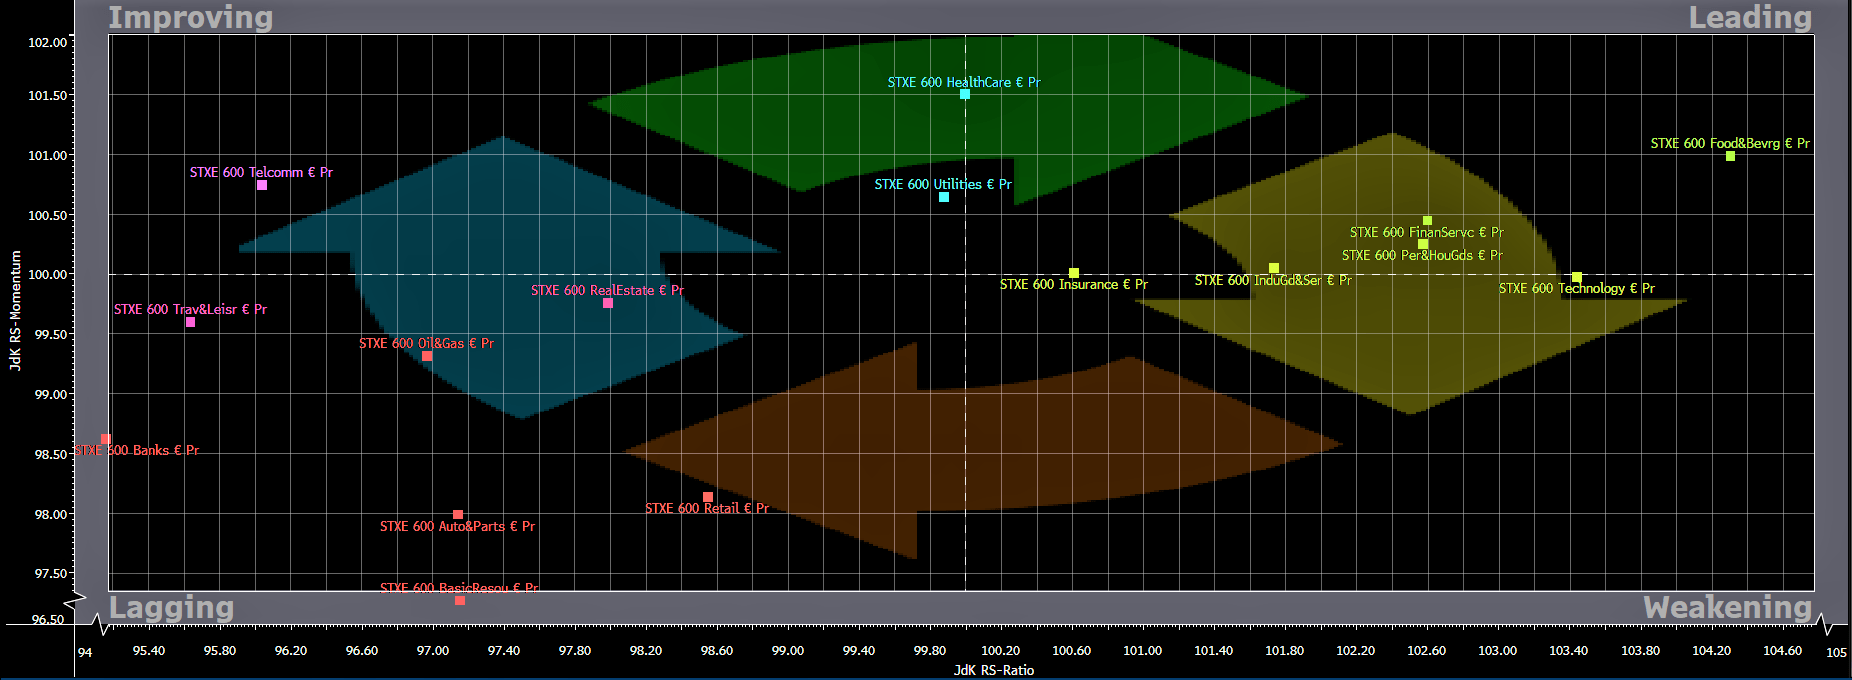
Source: Bloomberg/City Index
Over the last 12 weeks, sectors typically regarded as akin to safe havens, Healthcare and Utilities have risen into the ‘leading’ quadrant to join Food & Beverages. They’re replacing recent outperformer Technology, a conglomerate of industries seen as more cyclical and prone to being dropped as investor nerves rise.
Perhaps what we know about the usual patterns of investor behaviour no longer applies. Alternatively, investors may be signalling they expect risk aversion to regain traction in the second half of the year.
Latest market news
Today 08:33 AM
Yesterday 11:48 PM
Latest Shares market articles
November 2, 2023 01:41 PM
November 1, 2023 01:33 PM
October 31, 2023 01:15 PM
October 31, 2023 10:24 AM