April 23, 2020 5:10 PM
EUR/JPY – Headline Trading at its Best
It has been quite volatile for the Euro vs the Japanese Yen today. Let’s review some of the headlines that have been released over the past 24 hours that have affected the direction of EUR/JPY:
1) European PMIs were released over the first few hours of the European session. For the most part, the data was worse than expected, which caused EUR/JPY to slowly move lower from roughly 116.60 to 115.73.
2) Just before the US market opened, the Nikkei reported that the Bank of Japan (BoJ) was considering “unlimited” bond buying at its meeting next week and my double the purchases of corporate bonds and commercial paper. EUR/JPY quickly moves higher from roughly 115.80 to 116.65.
3) EU leaders end talks with no agreement on recovery package. France’s Macron said, “Europe has no future if we cannot find a response to this exceptional shock”. EUR/JPY moved back below 115.80 on these comments. (Although talks end without a package, Germany’s Merkel and Italy’s Conte say progress has been made.)
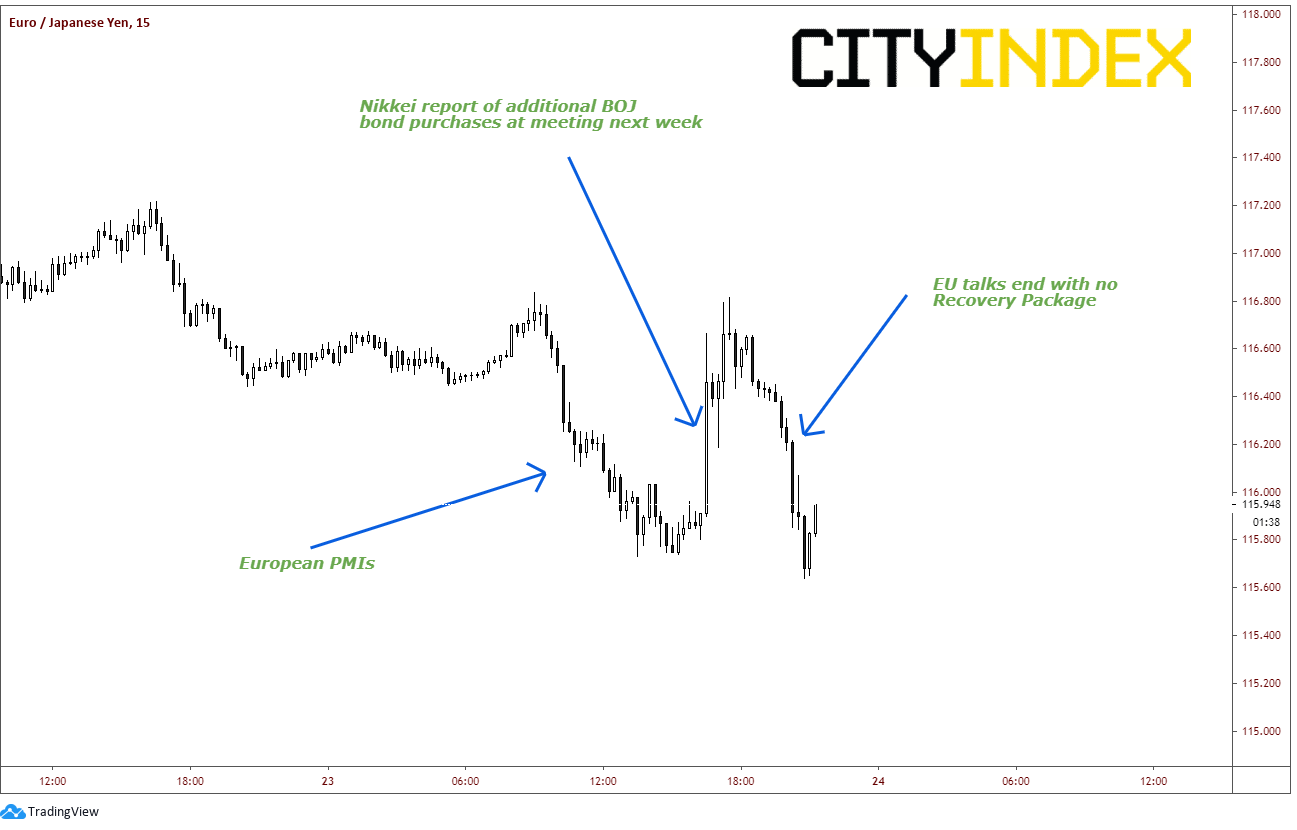
Source: Tradingview, City Index
On a daily timeframe chart, it appears that over the long-term, EUR/JPY was heading down to 116.00 regardless of the comments . Today’s bounce was used as an opportunity for bears to add to positions and push the pair lower. EUR/JPY has been in a downward sloping channel since January 2018. More recently, EUR/JPY had been in an ascending wedge from August 2019 to January of this year. The pair broke lower on January 29th and traded violently to the 100% retracement target of the ascending wedge TODAY at 115.86.
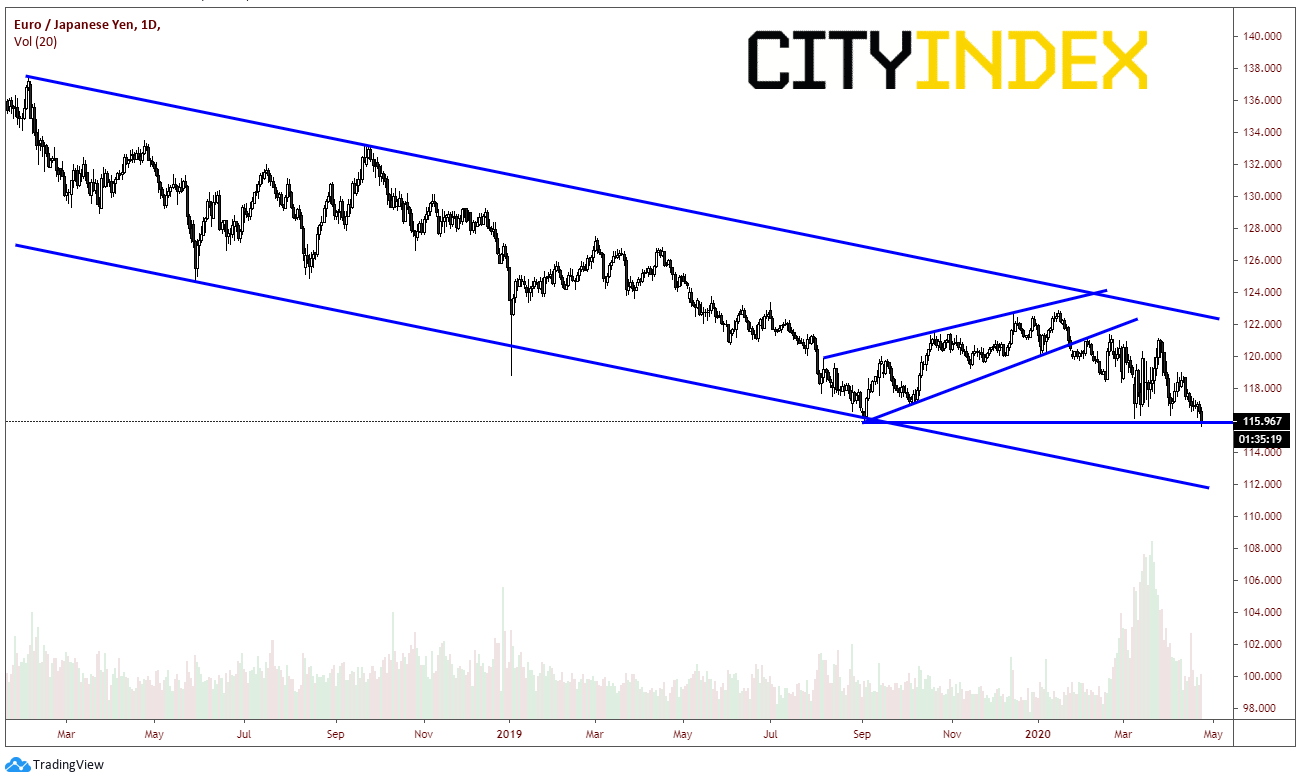
Source: Tradingview, City Index
On a 240-minute timeframe, EUR/JPY has been trading in a descending triangle since March 25th . Today price finally broke below the horizontal support level at 116.10. That level now acts as the first level of resistance. The next level of resistance is today’s highs 116.83 and then the downward sloping trendline from the triangle near 117. First support is down at today’s lows near 115.65, which is also the 127.2% Fibonacci extension level from the lows on April 2nd to the highs on April 9th. Below that, support is at the 161.8% Fibonacci extension from the same time period at 114.73 and final support is at the bottom, downward sloping trendline of the long-term channel (on the daily) near 112.00.
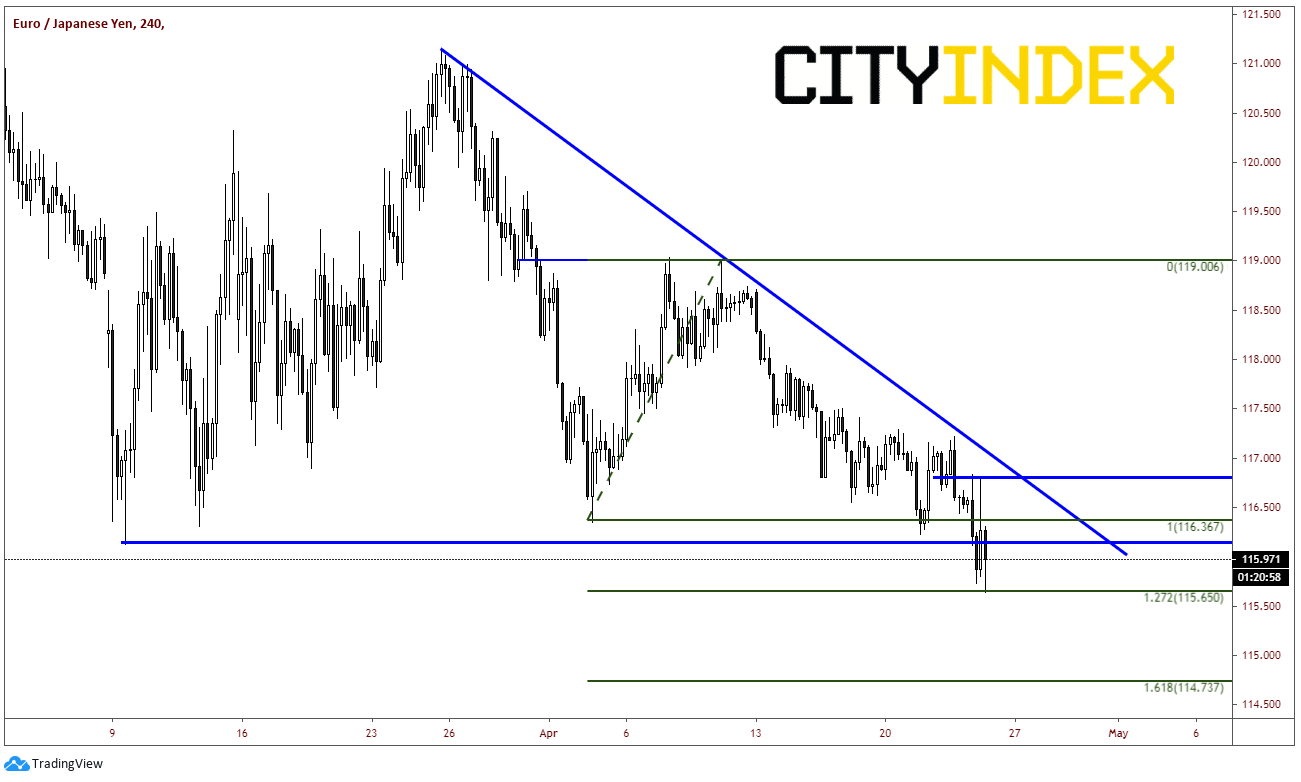
Source: Tradingview, City Index
If one is looking to trade the short-term headlines, it’s best to look at the longer-term trend to determine which direction to trade. Traders who had been aware of the longer-term, descending channel or the descending triangle in EUR/JPY would have also been aware to “sell the rips” on the headlines today!
Latest market news
Today 10:37 AM
Today 08:25 AM
Latest EUR articles

April 13, 2024 08:00 PM
March 25, 2024 02:55 AM

January 22, 2024 04:19 AM
January 18, 2024 04:46 AM