


Short-term technical outlook on EUR/GBP
click to enlarge charts
Key Levels (1 to 3 days)
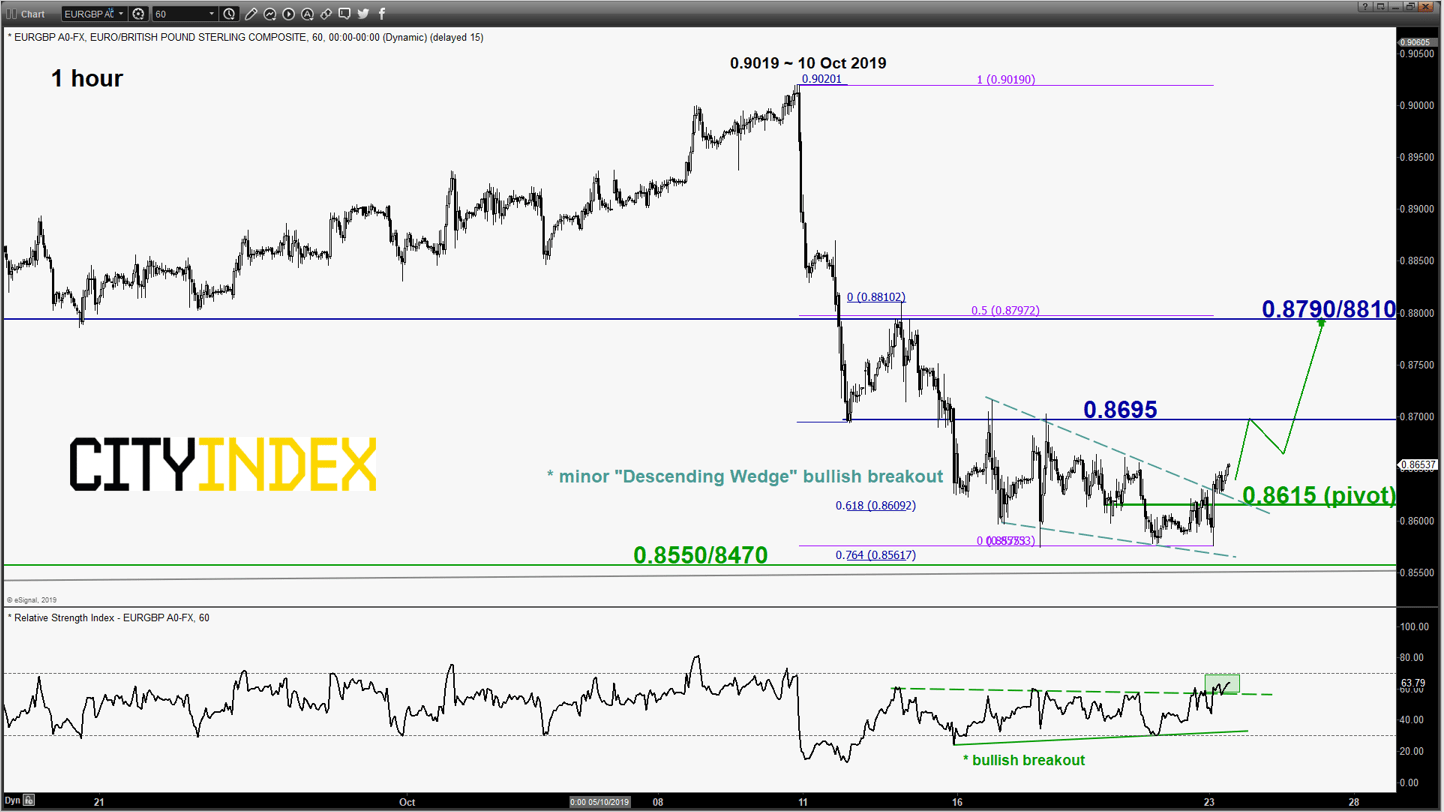
Pivot (key support): 0.8615
Resistances: 0.8695 & 0.8790/8810
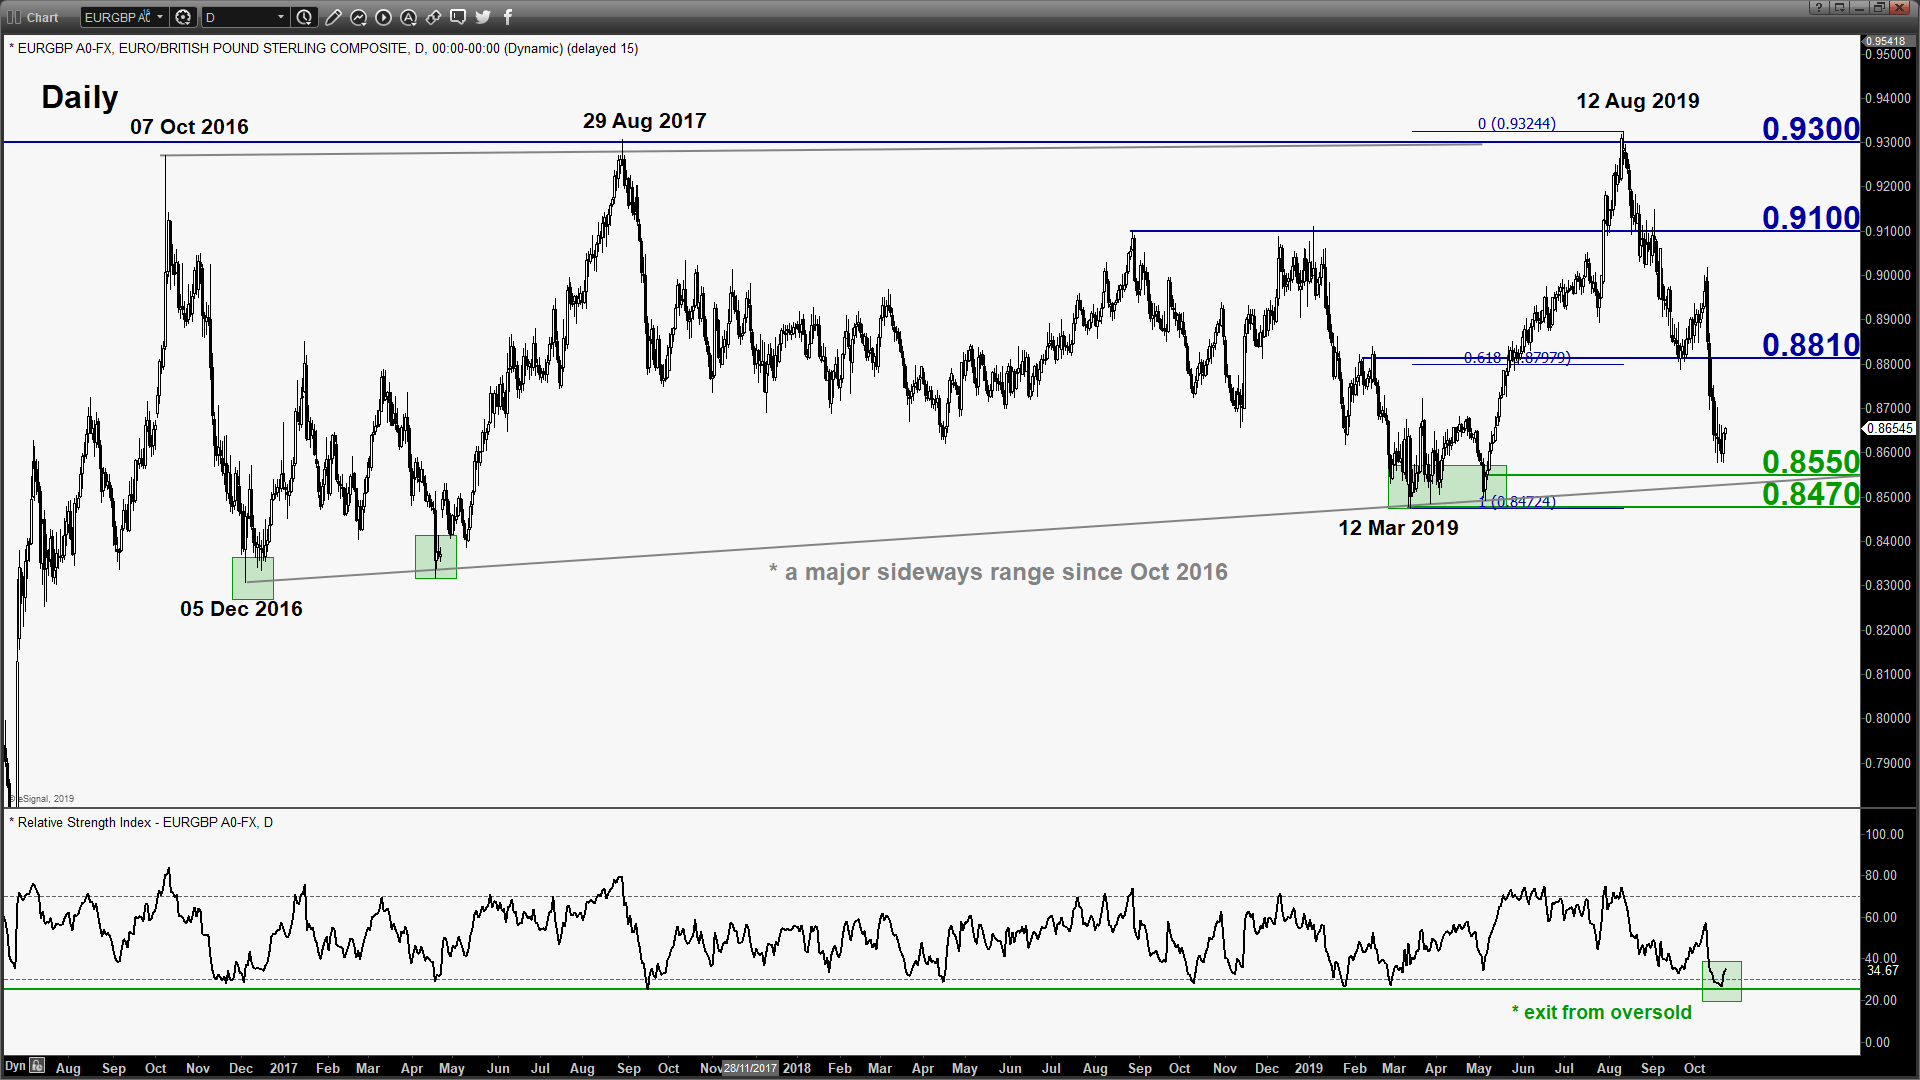
Next support: 0.8550/8470 (key medium-term pivot)
Directional Bias (1 to 3 days)
The EUR/GBP cross pair is now due for a rebound after an “overextended” decline of 440 pips from 10 Oct 2019 high of 0.9019. Bullish bias above 0.8615 key short-term pivotal support for a potential push up to target the next intermediate resistances at 0.8695 and 0.8790/8810.
However, an hourly close below 0.8615 invalidates the short-term bullish scenario for a continuation of the slide to test the medium-term pivotal support 0.8550/8470 (also the major range support in place since Dec 2016 low.
Key elements
- From 16 Oct 2019 minor swing high area of 0.8695 to 21 Oct 2019 low of 0.8578, the cross pair has evolved into a minor “Descending Wedge” configuration. The “Descending Wedge” chart pattern tends to indicate the end of a downtrend (minor) since it is being detected on the hourly chart where the magnitude of the “lower lows” is less than the magnitude of the “lower highs”. These observations suggest the bears have started to lose momentum to push prices lower.
- Elliot Wave/fractal analysis also indicates the potential exhaustion end of the aforementioned minor downtrend from 10 Oct high to 21 Oct 2019 low where a 5th wave 0.764 Fibonacci projection coincides closely with the 21 Oct 2019 minor swing low area of 0.8575 by measuring the decline from 10 Oct high to 11 Oct low projected from 14 Oct 2019 high on the hourly chart.
- Prior to the bullish breakout seen on the hourly RSI oscillator, it has shaped a bullish divergence signal while price action of the pair has continued to shape corresponding “lower lows” from 16 Oct to 21 Oct 2019. In addition, the daily RSI oscillator has just exited from its oversold region. These observations suggest the short to medium-term downside momentum has eased.
- The significant intermediate resistance of 0.8790/8810 is defined by the minor swing hig area of 14 Oct 2019 and the 50% Fibonacci retracement of the recent steep decline from 10 Oct low to 21 Oct 2019 low.
Charts are from eSignal
Latest market news
Yesterday 11:09 PM
Yesterday 11:01 PM
Yesterday 04:00 PM
Yesterday 01:15 PM
Yesterday 11:30 AM
Yesterday 08:18 AM
Latest EUR articles
April 13, 2024 08:00 PM
March 25, 2024 02:55 AM
January 22, 2024 04:19 AM
January 18, 2024 04:46 AM