EUR USD wavers on mixed US employment report
Key data describing the US employment situation for February was released on Friday in the form of the Non-Farm Payrolls (NFP), Unemployment Rate, and Average […]
Key data describing the US employment situation for February was released on Friday in the form of the Non-Farm Payrolls (NFP), Unemployment Rate, and Average […]
Key data describing the US employment situation for February was released on Friday in the form of the Non-Farm Payrolls (NFP), Unemployment Rate, and Average Hourly Earnings. Although the headline NFP number showed a substantially better-than-expected reading, the overall employment picture was decidedly mixed from both an economic growth and inflation standpoint. This was due to the fact that average hourly earnings unexpectedly fell, sparking concerns of a continuing lag in inflation. As a primary driver of the Federal Reserve’s decision-making process for monetary policy, inflation holds a vital key as to whether or not the Fed continues raising rates and the timing of such potential rate hikes.
The US added 242,000 jobs in February, significantly surpassing prior consensus expectations of 195,000 jobs added. Additionally, January’s lower-than-expected reading of 151,000 was revised up on Friday to 172,000. The US unemployment rate remained at the prior month’s 8-year low of 4.9%, in line with prior expectations. The glaring negative in the US employment landscape, however, was that average hourly earnings actually declined in February by 0.1%, against prior expectations of a 0.2% increase. As noted, the Fed considers this an inflation indicator, and the negative reading could provoke a more dovish policy stance and a reason not to continue raising interest rates.
After this jobs data was released on Friday, the US dollar and US stock index futures initially surged on the headline NFP number, while the price of gold correspondingly sank. Very quickly, however, these markets began to reverse and then waver as the potential ramifications of the wage decline weighed on investor sentiment.
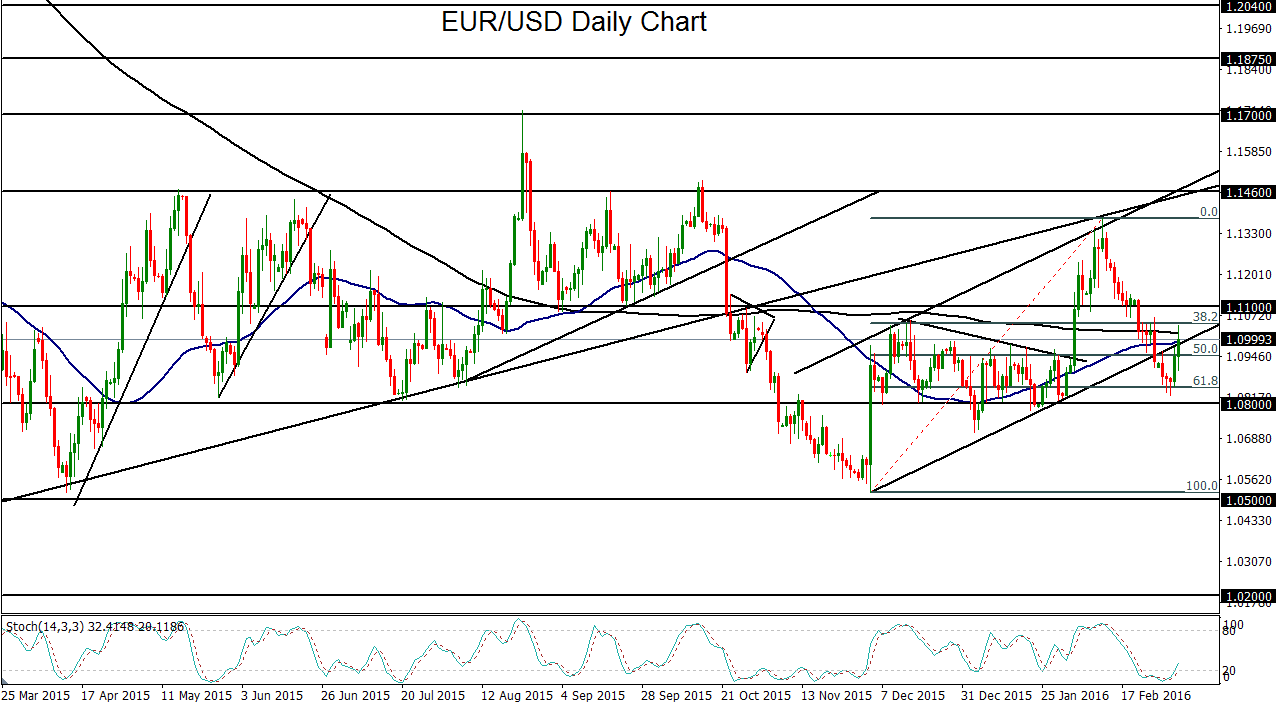
This wavering was readily seen on the EUR/USD chart, which initially dropped and then rose early on Friday to extend Thursday’s rebound. This extended rebound on both Thursday and early Friday was primarily due to a sliding US dollar.
Prior to this rebound, the currency pair had fallen sharply in the past three weeks, largely because of increasing pressure on the European Central Bank (ECB) to implement additional monetary easing measures. The eagerly-awaited ECB press conference is slated for next week, and ECB President Mario Draghi has already made comments in recent weeks indicating a strong willingness and readiness to take such actions in the face of low inflation and weak economic growth. During the course of that EUR/USD three-week slide, the currency pair broke down below key support factors, including the 1.1100 level, both the 50-day and 200-day moving averages, and a key uptrend channel extending back to early December’s low near 1.0500.
Despite the current EUR/USD rebound, the specter of further ECB easing is arguably more bearish for the euro than a weak US inflation reading is for the dollar. With this perspective, the outlook for EUR/USD remains bearish, at least until the ECB press conference next week provides further clarity on the central bank’s policy stance going forward. With strong resistance remaining at the noted 1.1100 level, any turn back to the downside should continue to target the key 1.0800 level, followed further to the downside by the major 1.0500 support objective.