EUR USD short squeeze rally running out of juice
The EUR/USD staged a bit of a short-squeeze rally in the first half of this month as traders speculated over the timing of the first […]
The EUR/USD staged a bit of a short-squeeze rally in the first half of this month as traders speculated over the timing of the first […]
The EUR/USD staged a bit of a short-squeeze rally in the first half of this month as traders speculated over the timing of the first Federal Reserve rate hike. Though the Fed will almost certainly raise rates before the ECB even turns hawkish, the EUR/USD’s recent price action suggests that the current and expected rate differential between the two central banks is now largely priced in. It appears as though the market is waiting to hear something unexpected to move prices aggressively in one or the other direction from these levels. Either that or the bears are about to come back in force after their lukewarm attempts during the summer to drive prices significantly lower. In any event, a Fed rate hike in September (as opposed to, say, December) should be good news for the dollar bulls, which – if seen – could undermine the EUR/USD. Conversely, if the dollar bulls are disappointed come 17th September then the EUR/USD could move sharply higher. Until then, speculators may have to contend with trading ranges as opposed to trends when it comes to the EUR/USD currency pair.
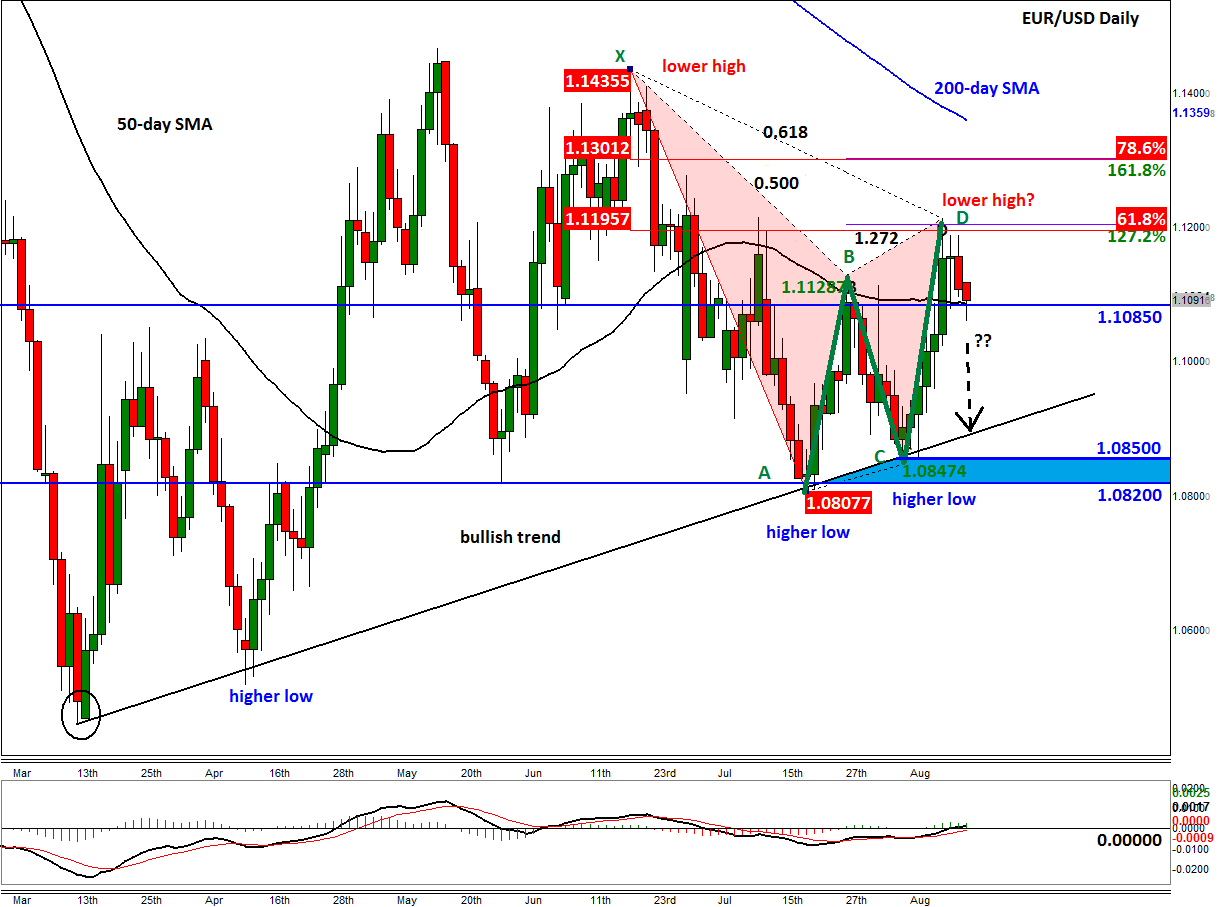
That being said though, there could be sharp moves within the large ranges that the EUR/USD is likely to trade within over the next month. Indeed, price has been making a series of higher lows since bottoming out at just below 1.05 in March, so a bullish trend is in play now. But in the second of half last week, the EUR/USD rallied into but failed to break the key resistance area circa 1.1200. Here, price may have formed a top and its second lower high which could thus precede a sharp sell-off. As can be seen from the chart, the area around 1.1200 marks the point D of an AB=CD pattern and is where two Fibonacci levels converge: the 61.8% retracement from the last lower high (point X) and the 127.2% extension of the last notable downswing (from point B to C). In other words, 1.1200 marks the “sell” point of a bearish Gartley pattern. So far, this pattern has lived up to its name as price has already dropped by a good 140 pips from 1.1200 to a low so far of about 1.1060.
At the time of this writing, the EUR/USD was holding above its 50-day moving and support around 1.1085. If it closes below here today or in one of the upcoming sessions then a sharp sell-off towards the bullish trend line around 1.0900, and potentially beyond, could be the most likely outcome. The key support area is around 1.0820/50. If the EUR/USD were to break below here as well, it would create a clear lower low which would be very bearish outcome.
Conversely, if the bulls defend the 1.1085 support level and price eventually breaks above the 1.1200 handle then we may see an eventual rally towards the next Fibonacci-based resistance area around 1.1300. Thereafter is the 200-day moving average, currently at 1.1360, ahead of a more significant resistance zone around 1.1435.
Figure 1: