EUR USD range trading between major support and resistance
EUR/USD (daily chart shown below) has settled between two major support/resistance levels with a currently bearish trend bias. Starting off the new week trading around […]
EUR/USD (daily chart shown below) has settled between two major support/resistance levels with a currently bearish trend bias. Starting off the new week trading around […]
EUR/USD (daily chart shown below) has settled between two major support/resistance levels with a currently bearish trend bias.
Starting off the new week trading around the 1.3600 handle, the currency pair has major upside resistance around the 1.3700 level and major downside resistance around the 1.3500 level.
After dropping by 3.5% during May and part of June from its long-term high of 1.3993 down to the noted 1.3500 support level, and then rebounding back up to 1.3700 resistance in late June, EUR/USD turned sharply back down from 1.3700 two weeks ago.
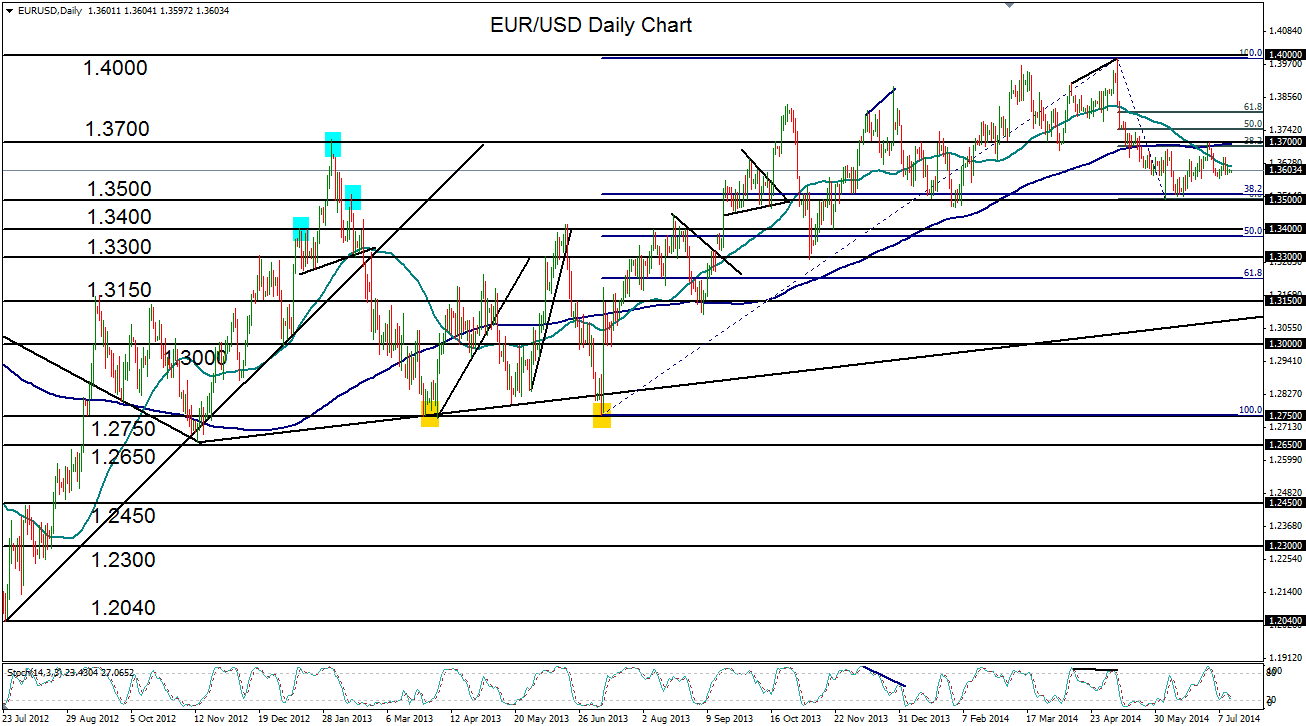
That key resistance at 1.3700 was also around where the 200-day moving average was situated, as well as the 38% Fibonacci retracement of the noted drop from 1.3993 down to 1.3500.
Currently range trading between the two key support and resistance levels of 1.3500 and 1.3700, the pair’s 50-day moving average has been declining steadily below its 200-day moving average. This comes after it crossed down in late June for the first time in over a year.
This decidedly bearish technical indication contributes to the overall bearish bias for EUR/USD.
A breakdown below 1.3500 support would confirm this bearish bias with a downside target at 1.3300.
The alternate event of a strong breach above 1.3700 resistance could discount the current bias, with further upside resistance around the 1.3800 level.
