EUR USD pulls back after eurozone GDP Greek bailout vote
EUR/USD (daily chart shown below) fell back down towards the key 1.1100 level on Friday after preliminary GDP data from Germany, France, and Italy were […]
EUR/USD (daily chart shown below) fell back down towards the key 1.1100 level on Friday after preliminary GDP data from Germany, France, and Italy were […]
EUR/USD (daily chart shown below) fell back down towards the key 1.1100 level on Friday after preliminary GDP data from Germany, France, and Italy were all reported to have grown less than expected in the second quarter. Overall, the euro zone economy grew by only 0.3% quarter-on-quarter in the period from April to June, against expectations of 0.4%.
This data helped pressure the euro despite a modest surge for the shared currency early on Friday that was prompted by the Greek parliament voting to pass the country’s third bailout agreement.
Also weighing on the EUR/USD on Friday was an enduring US dollar that, despite an earlier drop, was quick to recover its resiliency against other major currencies.
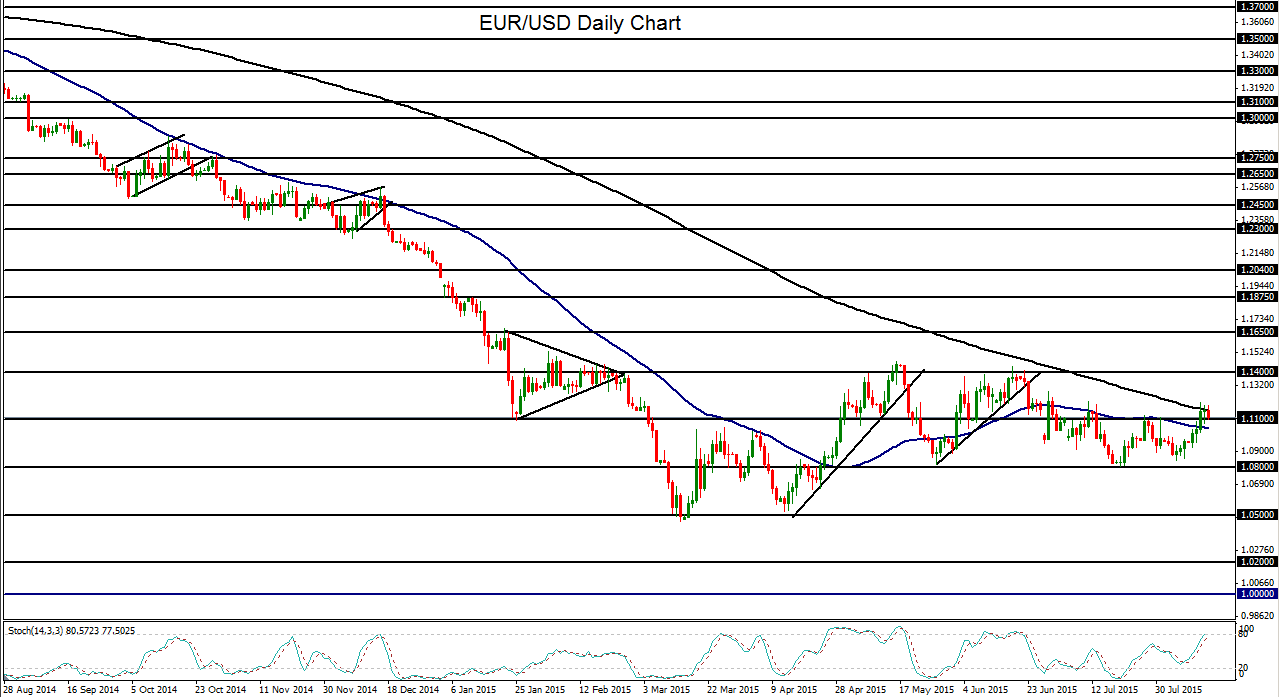
Prior to Friday, EUR/USD had seen more than a week of gains from just above the 1.0800 support level. Earlier this week, those gains had pushed the currency pair above both its 50-day moving average and prior resistance around the noted 1.1100 level.
Above 1.1100, EUR/USD then rose higher to reach, but not quite breach, major resistance around its 200-day moving average. A sustained close above the 200-day moving average has not occurred since mid-year last year. Furthermore, for the past three days, the currency pair has not been able to break appreciably above this 200-day moving average.
With any re-breakdown and sustained trading below the 1.1100 level, EUR/USD could resume its bearish stance as the euro shrugs off positive developments in the Greek debt crisis and the US is likely to raise interest rates this year, leading to a further potential strengthening of the dollar.
In the event of such a turn back to the downside, EUR/USD could reverse its gains of the past week and fall once again back down towards the key 1.0800 support level. A further breakdown below 1.0800 should target multi-year lows around the 1.0500 support objective.
In the short-term, key intermediate resistance to the upside on any further rebound above the 200-day moving average currently resides around the 1.1300 level.
