EUR USD drops sharply from resistance
EUR/USD (daily chart) has dropped sharply from key resistance around the 1.3700 level, which is also where the 200-day moving average resides. Additionally the 1.3700 […]
EUR/USD (daily chart) has dropped sharply from key resistance around the 1.3700 level, which is also where the 200-day moving average resides. Additionally the 1.3700 […]
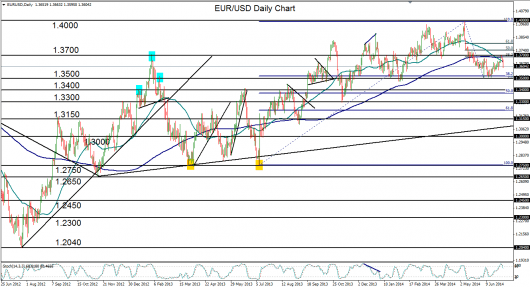
EUR/USD (daily chart) has dropped sharply from key resistance around the 1.3700 level, which is also where the 200-day moving average resides. Additionally the 1.3700 level is around the 38% Fibonacci Retracement of the recent decline from the early May 1.3993 high, down to the early June 1.3501 low. The current week’s declines suggest that EUR/USD may be in the beginning stages of a new bearish trend, or at least a correction, that could bring the currency pair down significantly further than it already has from May’s long-term highs near 1.4000.
The 50-day moving average has made an important cross below the 200-day moving average - a condition not seen for more than a year. This adds weight to the longer-term bearish bias. The currency pair is also now trading well below both of these key moving averages. Major upside resistance on any rebound continues to reside around the pivotal 1.3700 level. To the downside the key event to watch for would be a breakdown below 1.3500, in which case the major intermediate downside target resides around the 1.3300 support level.
