EUR USD bears in control again lower low awaited
The one hour chart of the EUR/USD shows that it may have formed a near-term double top at 1.0965. This points to further price weakness […]
The one hour chart of the EUR/USD shows that it may have formed a near-term double top at 1.0965. This points to further price weakness […]
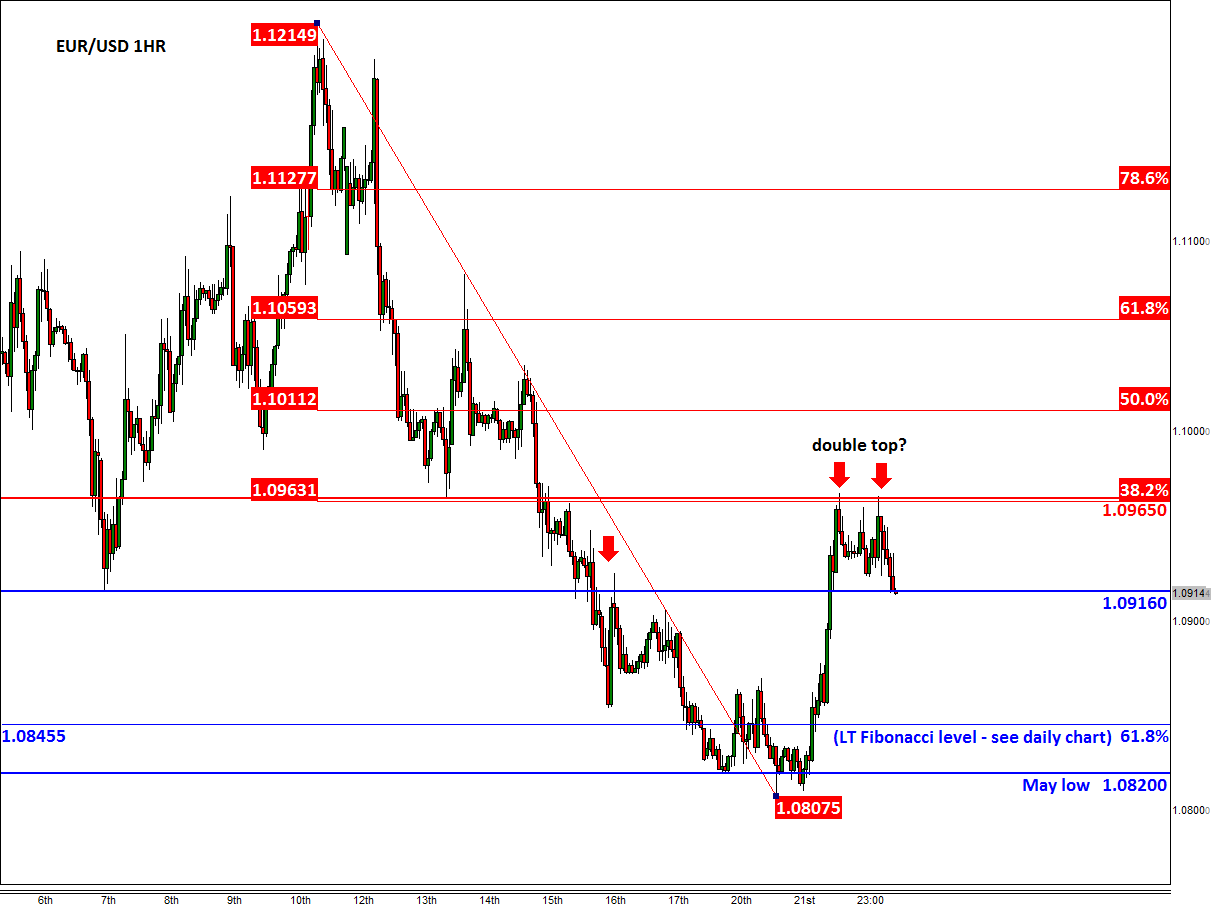
The one hour chart of the EUR/USD shows that it may have formed a near-term double top at 1.0965. This points to further price weakness and we may after all see the world’s most heavily traded FX pair break below May’s low and key support of 1.0820 before heading significantly lower in the coming weeks. Thus going forward the key levels to watch are 1.0965 to the upside and 1.0820 to the downside; a break outside of this range could lead to a sharp move in that direction.
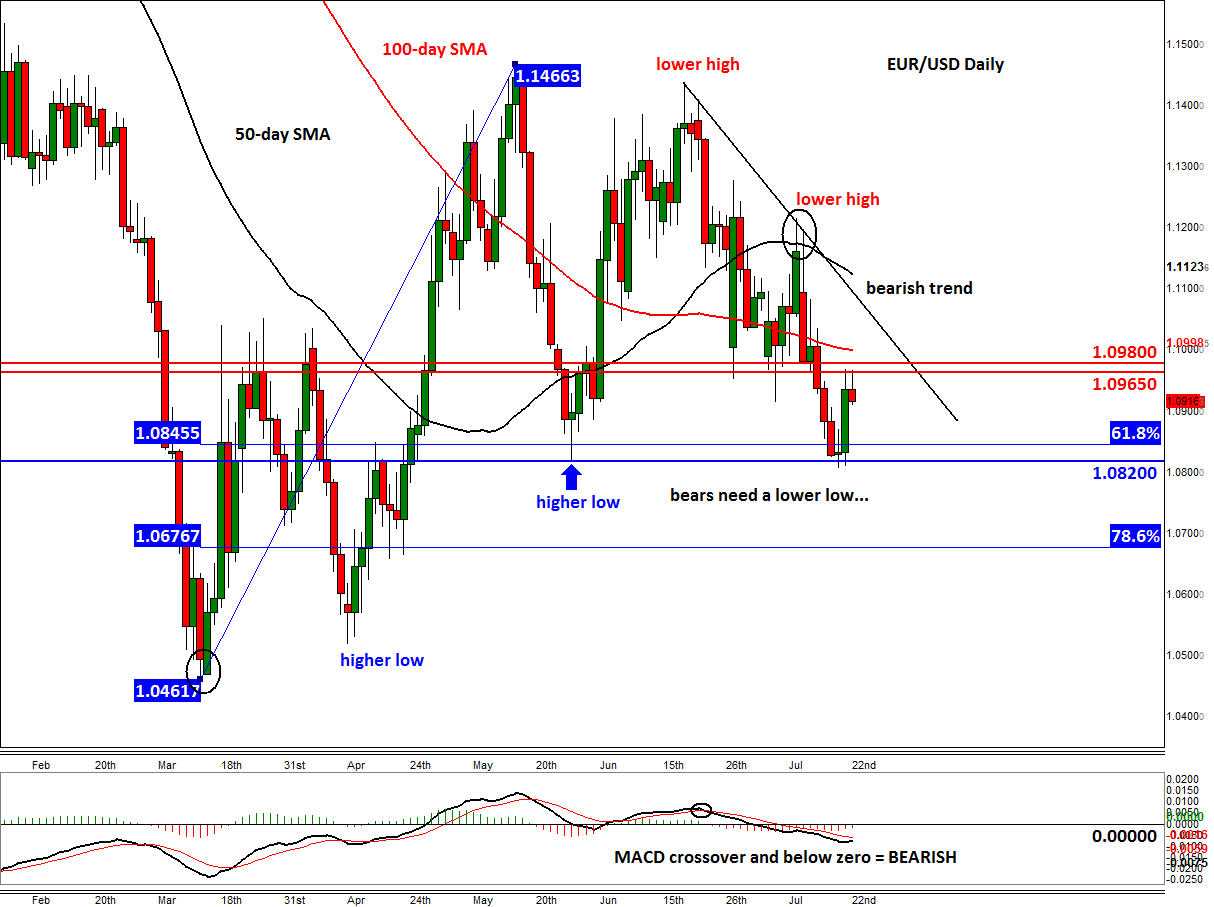
As the daily chart shows, the EUR/USD has been trending lower in recent weeks. The investor focus has returned to the interest rate differential between the US and Eurozone economies. Whereas the Fed has signalled that it is ready to hike rates later this year, the ECB has only recently started QE and last week there were no suggestions from President Mario Draghi today that the central bank is ready to trim or end the €60 billion a month stimulus programme early. Thus, the ultra-accommodative monetary policy is here to stay for now and this should in theory put downward pressure on European bond yields, which in turn could depress the euro even further.
The trend is clearly bearish for the EUR/USD, which has now made two clear lower highs and today it could be making another. Though it has also made some minor lower lows, it is yet to make a distinct one. But that could change if it breaks the June low of around 1.0820. As the 61.8% Fibonacci retracement of the rally from the March low, at 1.10845, is also not too far off the June low, this makes 1.0820/45 a key support area. Thus a closing or decisive break below here could see the remaining bulls bail out on their positions. This could lead to further follow-up technical selling in the pursuing days. Unsurprisingly, the momentum indicator MACD is trending lower and is below zero, suggesting the bears are in in full control.
If the abovementioned 1.0820/45 support area breaks down, the next potential stop could be the 78.6% retracement at 1.0675. Thereafter is the March low at just above 1.0460 and then parity.
Meanwhile resistance comes in around 1.0965 and then at 1.0980. The short-term bias would remain bearish for as long as the sellers defend the downward-sloping trend line. If broken, we may see another sharp short-squeeze rally. The odds of that happening are very slim, however.