EUR USD 1 10 or 1 15 in this important week
EUR/USD fell as yields on the 10-year German bunds droped below zero for the first time while equivelant UK gilt yields hit a new record low on raised Brexit risks
EUR/USD fell as yields on the 10-year German bunds droped below zero for the first time while equivelant UK gilt yields hit a new record low on raised Brexit risks
Risk remained out of favour this morning as stocks tumbled and safe haven government bonds extended their rally, causing yields on the 10-year German bunds to drop below zero for the first time. In Britain, the equivalent yields have also fallen to a fresh record low level. This reflects the view that if Britain were to exit the EU, the Bank of England will have to either lower interest rates or introduce more QE to counter the economic consequences of Brexit. The probably that Brexit won’t happen has fallen to just 55% from around 64% on Monday, according to betting odds from Betfair.
The US economy and the dollar will also come under spotlight this week, with US retail sales due for publication at 13:30 BST (08:30 ET) today; PPI, industrial production and the FOMC on Wednesday, and CPI and jobless claims data on Thursday. Although the Fed will almost certainly not be raising interest rates come Wednesday, the central bank should provide us some clues in terms of when the next rate rise may be. Thus, the dollar will probably move sharply depending on how dovish or hawkish the central bank will choose to be, with CPI data also likely to provide some direction.
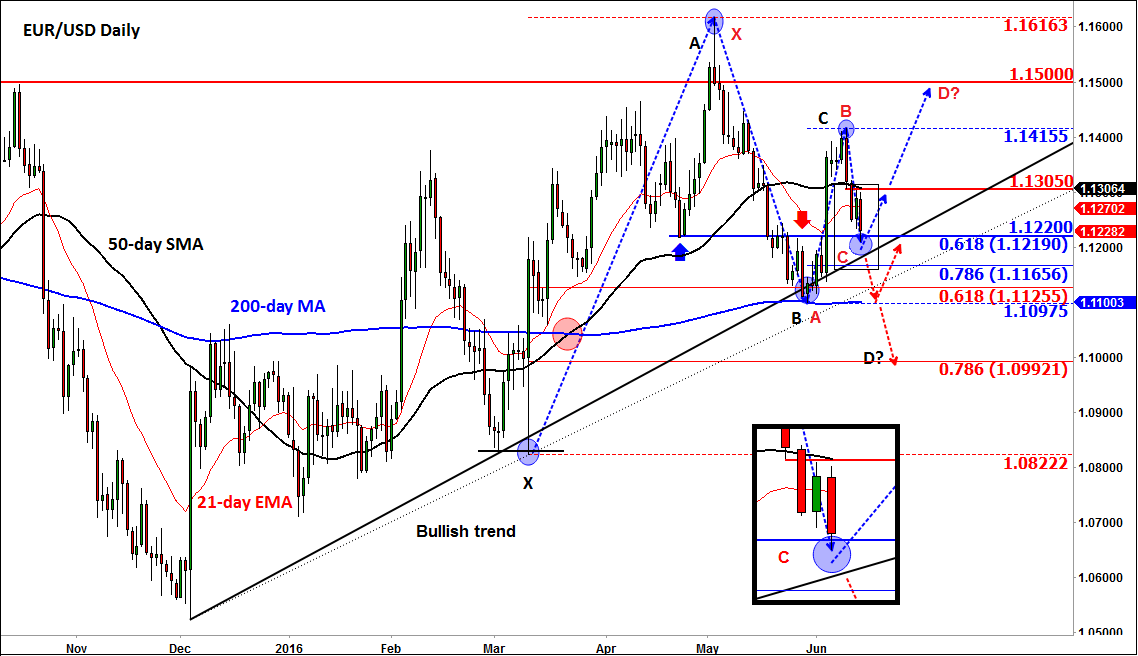
Ahead of the above fundamental events, the EUR/USD has reached a key technical level today, namely around 1.1210/20. As can be seen from the daily chart, below, this area was previously support and resistance. In addition, this is where the 61.6% Fibonacci retracement level comes into play. It is worth mentioning that this particular Fibonacci level has provided good support and resistance in the past. In this case, it also marks point C of an AB=CD move.
In fact, there are two alternative AB=CD patterns observable on the EUR/USD’s chart. The one in red is a potential Bearish Gartley pattern which would suggest a rally towards 1.15 then a potential sell-off, while the one in blue suggests that price may first drop to sub 1.10 before we see a potential rally. Soon, at least one of these AB=CD patterns will become invalid.
If the EUR/USD breaks decisively below the bullish trend line, around 1.1210, then a more significant correction towards the 200-day moving average at 1.11 would then become likely and if that level breaks down then a drop to at least 1.10 could be the next stop. Alternatively, a bounce at the noted bullish trend line, followed by a break above the next resistance and the 50-day moving average at 1.1305 would probably pave the way for a rally towards 1.15.