EUR JPY turning a corner
The EUR/JPY may have formed a reversal pattern at around 121.70-122.00 area at the end of last week. Price action has been bullish since, with […]
The EUR/JPY may have formed a reversal pattern at around 121.70-122.00 area at the end of last week. Price action has been bullish since, with […]
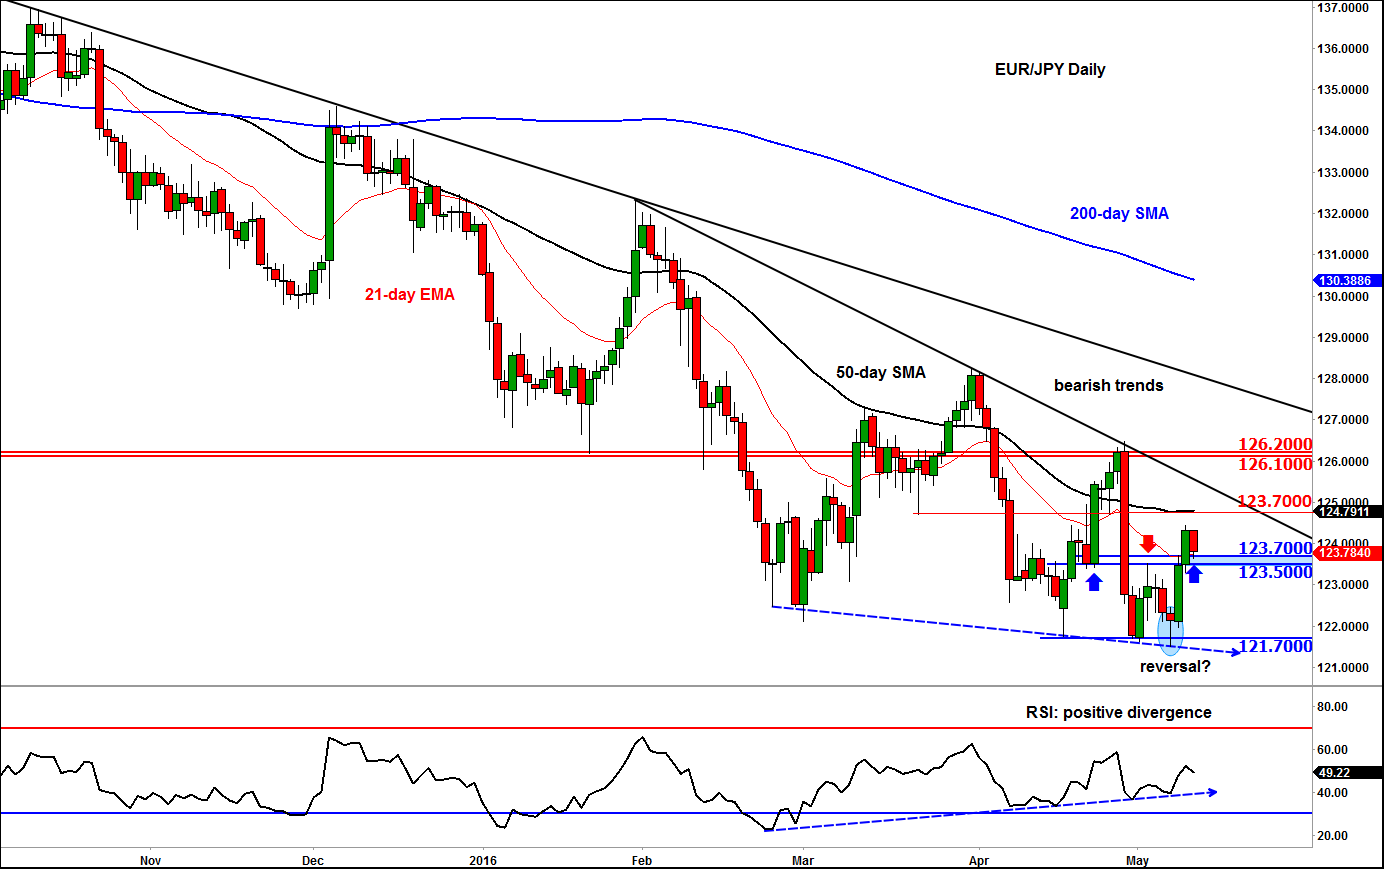
The EUR/JPY may have formed a reversal pattern at around 121.70-122.00 area at the end of last week. Price action has been bullish since, with some key short-term resistance levels broken down. However, there has been no confirmation of the reversal yet as the major bearish trend lines are still intact and the daily moving averages are all still pointing lower. Nevertheless, the EUR/JPY’s levels are clearly defined which makes it technically-friendly to trade even with a short-term focus.
The EUR/JPY’s bearish momentum has evidently been waning recently as it repeatedly tested supply below the 121.70-122.00 area without much progress to the downside. Both the daily and week RSI momentum indicators meanwhile have been putting in higher highs, therefore forming positive divergence with price. The last attempt on Friday by the bears to push the EUR/JPY below this key area once again failed which saw price form a small hammer-like candle on its daily chart. The weekly chart formed a small doji candle. Then, there was good follow-through at the start of this week which saw the EUR/JPY break above a key short-term resistance in the 123.50-123.70 area, which was now being tested as support at the time of this writing.
In addition to the RSI making positive divergence and the waning bearish momentum of price, the weekly chart shows that the EUR/JPY may be in the process of forming a more significant long-term falling wedge pattern. This pattern can only be confirmed in hindsight of course, when its resistance trend breaks. So, at this stage, it is a potential scenario. One further bullish point about the weekly chart is the fact that the support trend of the wedge pattern has met price at around the key 122 area. This level also marks the convergence of the 50% retracement level of the entire 2012-2014 upswing with the 127.2% extension of the corrective up move from April to June 2015. This further boosts the prospects of a change in the trend here.
But as mentioned, the reversal has not been confirmed yet. As such, one should treat the latest bounce as a counter-trend rally for now, as similar bounces have failed in the past. In particular, traders should watch the key resistance levels shown on the daily chart closely as price could stall there on reload selling or buy-side profit-taking pressure. The first such level is around 123.70 where the 50-day moving average converges with previous support. The first of the two bearish trend line comes in between this level and the next major reference point at the 126.10/20 area.
The abovementioned long-term bullish scenario would become invalid however if the EUR/JPY were to break decisively below the support trend of the wedge pattern around 121.50. In this scenario, it would become anyone’s guess in terms of how far the EUR/JPY could fall further, though some key levels to watch then would include the psychological 120 handle, followed by the Fibonacci levels at 116.85 (161.8% extension of BC) and 115.40 (61.8% retracement of XA).
Meanwhile a bearish scenario in the short-term outlook would be a breakdown below the key 123.50/70 support region. Should this happen, a pullback towards the recent lows would then become likely.