EUR JPY Rebounds to Resume Bullish Bias after Pullback
EUR/JPY (daily chart) as of February 25, 2013 has tentatively rebounded after dipping below key support in the 123.00 price region. This rebound has brought […]
EUR/JPY (daily chart) as of February 25, 2013 has tentatively rebounded after dipping below key support in the 123.00 price region. This rebound has brought […]
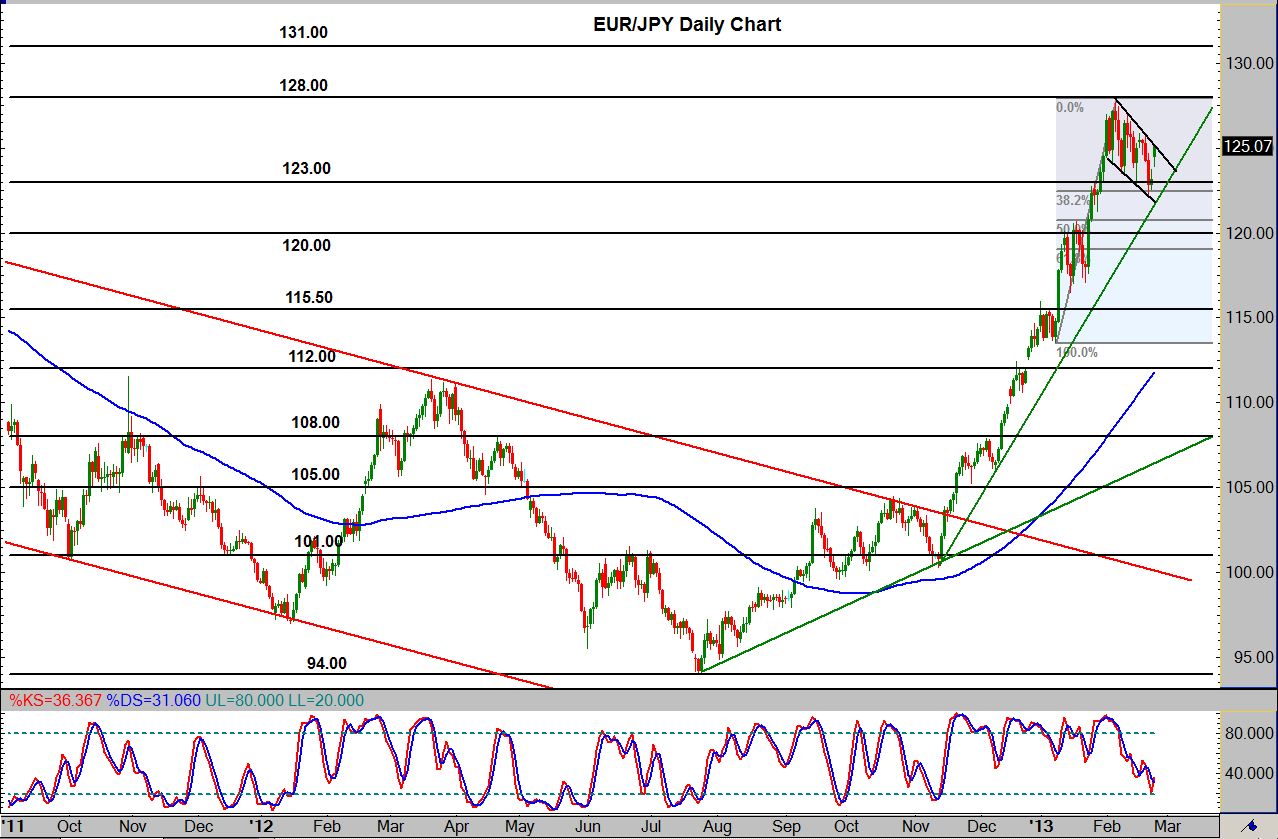
EUR/JPY (daily chart) as of February 25, 2013 has tentatively rebounded after dipping below key support in the 123.00 price region. This rebound has brought price back up to reach the 125.00 handle after hitting a multi-year high at 127.69 three weeks ago and then pulling back in a flag-like pattern formation below 123.00 support (which is also in the vicinity of the 38.2% Fibonacci retracement level of the last major bullish run from the 113.50 area). This occurs within the context of an exceptionally strong bullish trend which has been in place since July 2012 and which accelerated substantially to the upside in November 2012.
The bounce to the upside today formed a gap up to the upper border of the flag formation, where price has met some limited resistance. In the event of a strong breakout above this pullback pattern, the clear upside objective once again resides around key 128.00 resistance. A bullish trend continuation would be confirmed on a breakout above 128.00, with a further upside objective around 131.00 resistance. To the downside, major support on the existing pullback continues to reside around the 123.00 level.