EUR JPY Next domino to fall
The EUR/USD took its sweet time but it finally broke below 1.05 support today as the divergence of monetary policies in the US and Eurozone […]
The EUR/USD took its sweet time but it finally broke below 1.05 support today as the divergence of monetary policies in the US and Eurozone […]
The EUR/USD took its sweet time but it finally broke below 1.05 support today as the divergence of monetary policies in the US and Eurozone weighed. The single currency was below the $1.04 handle at the time of this writing. It wasn’t just the EUR/USD or the other FX majors that broke down. Buck-denominated gold, silver and oil all fell sharply too. The Fed turned more hawkish as it raised interest rates by 25 basis points and said there will probably be three more hikes to come next year. The ECB last week turned even more dovish as it extended its QE programme to at least the end of next year. The Bank of England sounded slightly more dovish today and although like the BoE the Swiss National Bank also kept its policy unchanged, it too warned of intervention if required. You get the picture: all the major central banks other than the Fed are dovish. Next week, it will be the Bank of Japan’s turn to have its say. Ahead of the BoJ meeting, the yen selling may pause. It may even reverse should the BOJ sound less dovish than expected. But if the USD/JPY fails to stop its bullish run ahead of the BOJ meeting, then there is a good chance that the EUR/JPY may do so now that the EUR/USD has broken down.
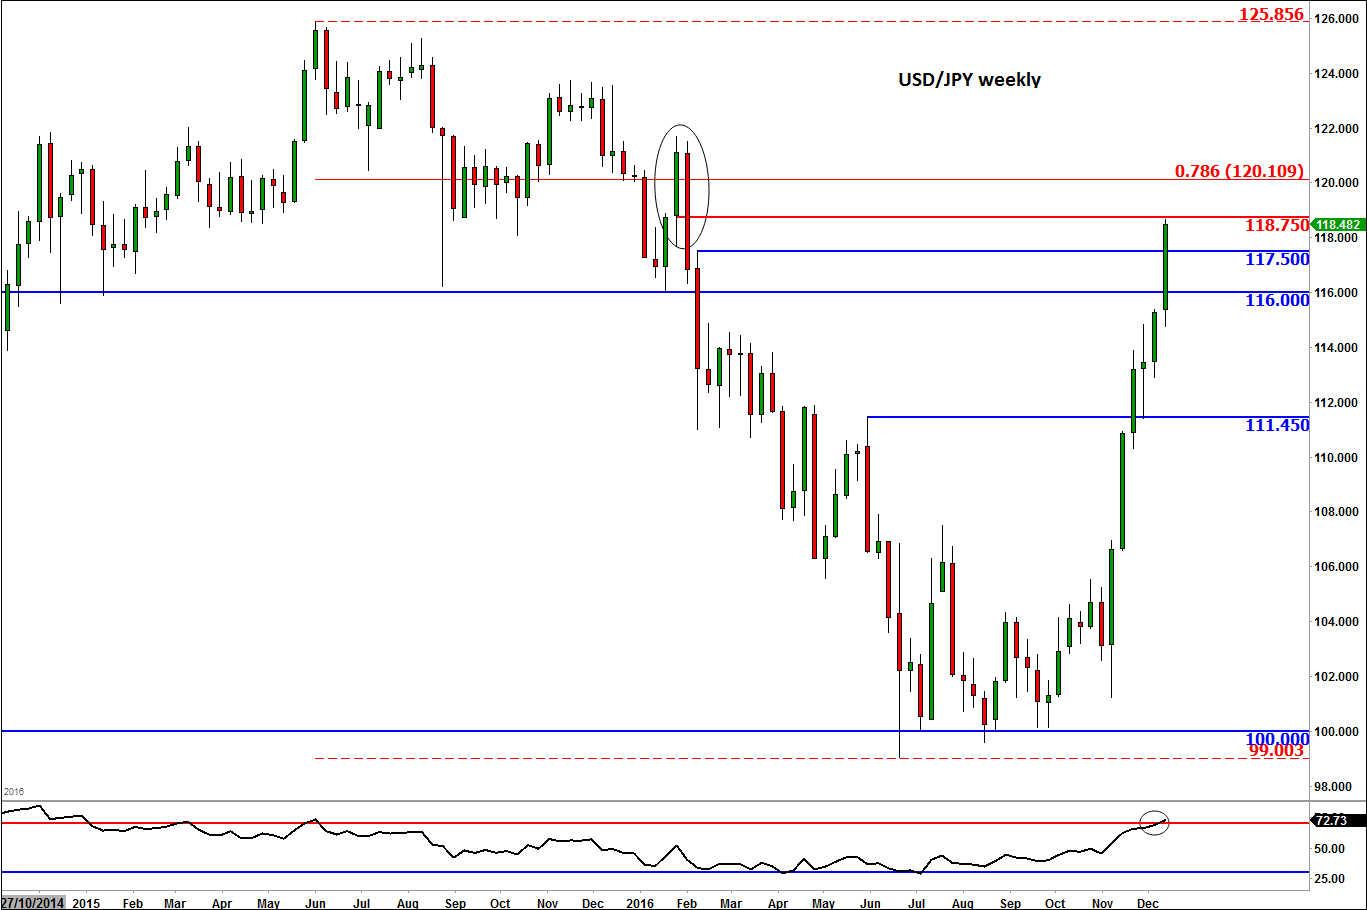
Before we look at the EUR/JPY, let’s take a quick look at the USD/JPY first (see figure 2). This pair has been on steroids. You don’t need the RSI to tell you it is ‘overbought’. But it can remain so for a long period of time, of course. Overbought in itself is not a sell signal, rather it is a sign for caution for existing longs and/or bullish speculators. Price action is clearly bullish, so any potential retracements here needs to be viewed as a pause in the trend, until and unless there is break in market structure of higher highs and higher lows. With the key 116.00 old support broken in the aftermath of the Fed decision, there are not many big resistances to watch apart from round psychologically-important levels such as 120 and 125. But on the weekly time frame, there is an interesting area around 118.75, which needs to be watched closely. As per the chart, this area marks the open of the last weekly up candle prior to the breakdown sub 116.00. It was above this 118.75 level where the selling pressure first started. Thus we may at the very least see a pause for breath at or around this level. If price turns lower, then the initial levels of support to watch include 117.50 and then that 116.00 handle. The technical bias would turn bearish once again if the latter fails to hold as support.
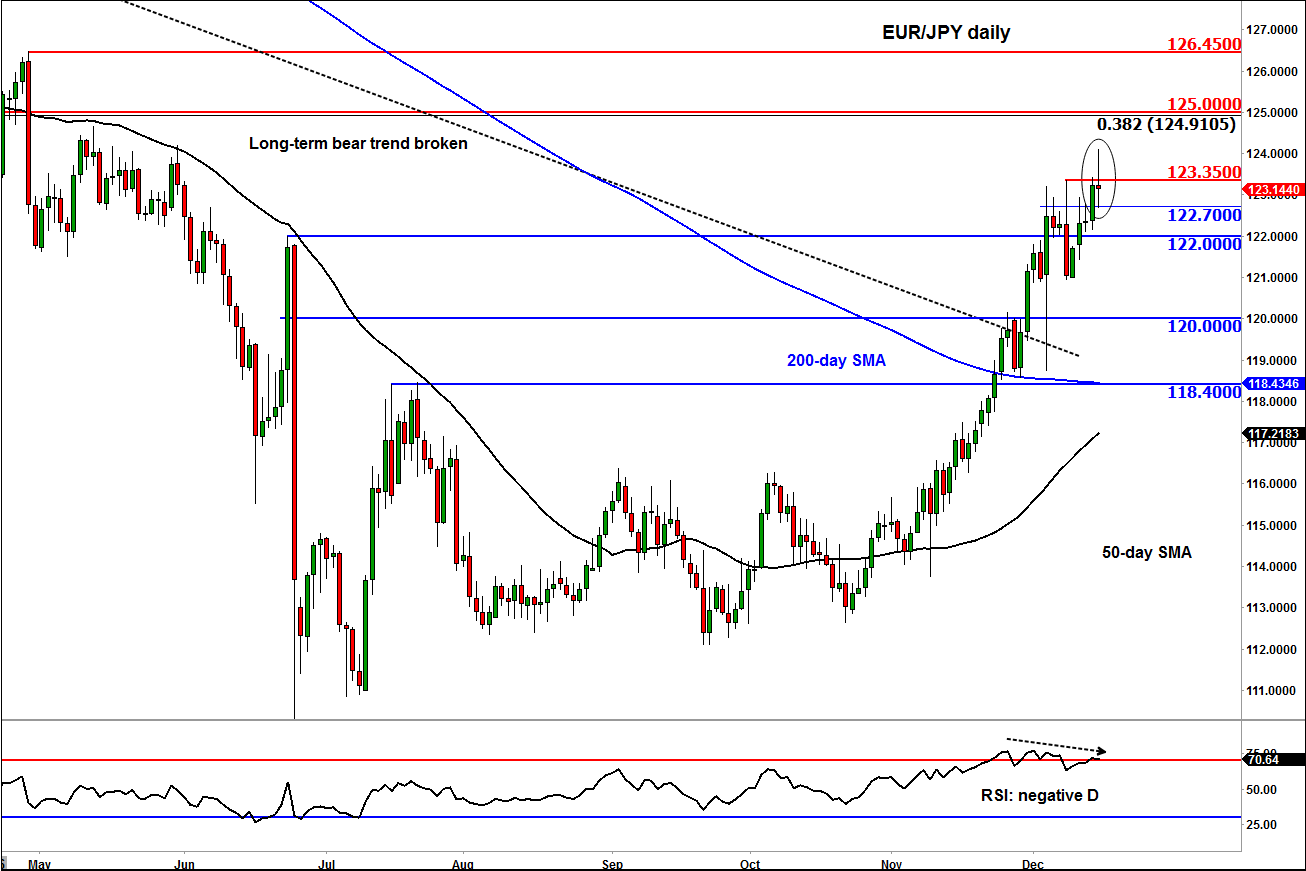
Now turning our attention to the EUR/JPY and we can see that it is having difficulty staying above 123.35 – the high from that large red candlestick made in the aftermath of the ECB’s decision on Thursday of last week. It is likely that there were a lot of stop orders stacked above the high of this candle, which have now been taken. With price failing to hold above it, the EUR/JPY may have to drop to test liquidity pools below market. So I am expecting the EUR/JPY to turn sharply lower, especially if short-term support around 122.70 breaks or ideally 122.00. A close above 123.35 would invalidate this bearish view.