


Intermarket relationship between emerging stock markets & USD/CNH
click to enlarge chart
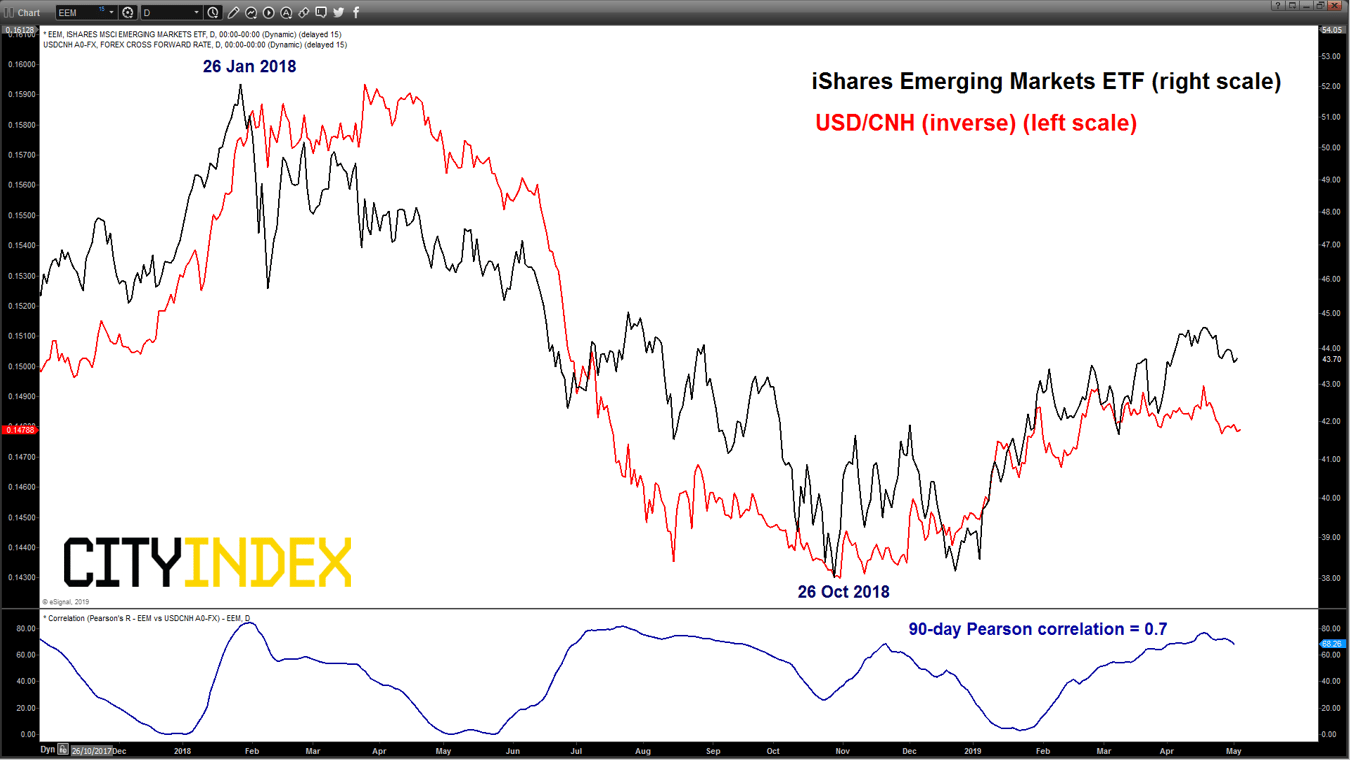
- Since 26 Oct 2018, the 17% rally seen in emerging stock markets as represented by the iShares Emerging Markets ETF (EEM) has been moving in direct lock-step with the movement seen in the inverse of USD/CNH pair which indicates that a stronger CNH (offshore Chinese Yuan) against the USD has been supportive on the on-going rally seen in emerging markets equities and vice versa if the opposite occurs.
- In addition, the 90-day Pearson’s correlation coefficient is showing a strong positive level of 0.7 which suggests a high degree of direct correlation between the movement of the EMM and USD/CNH (inverse).
USD/CNH - Bouncing off from 6.68/65 key medium-term support
click to enlarge chart
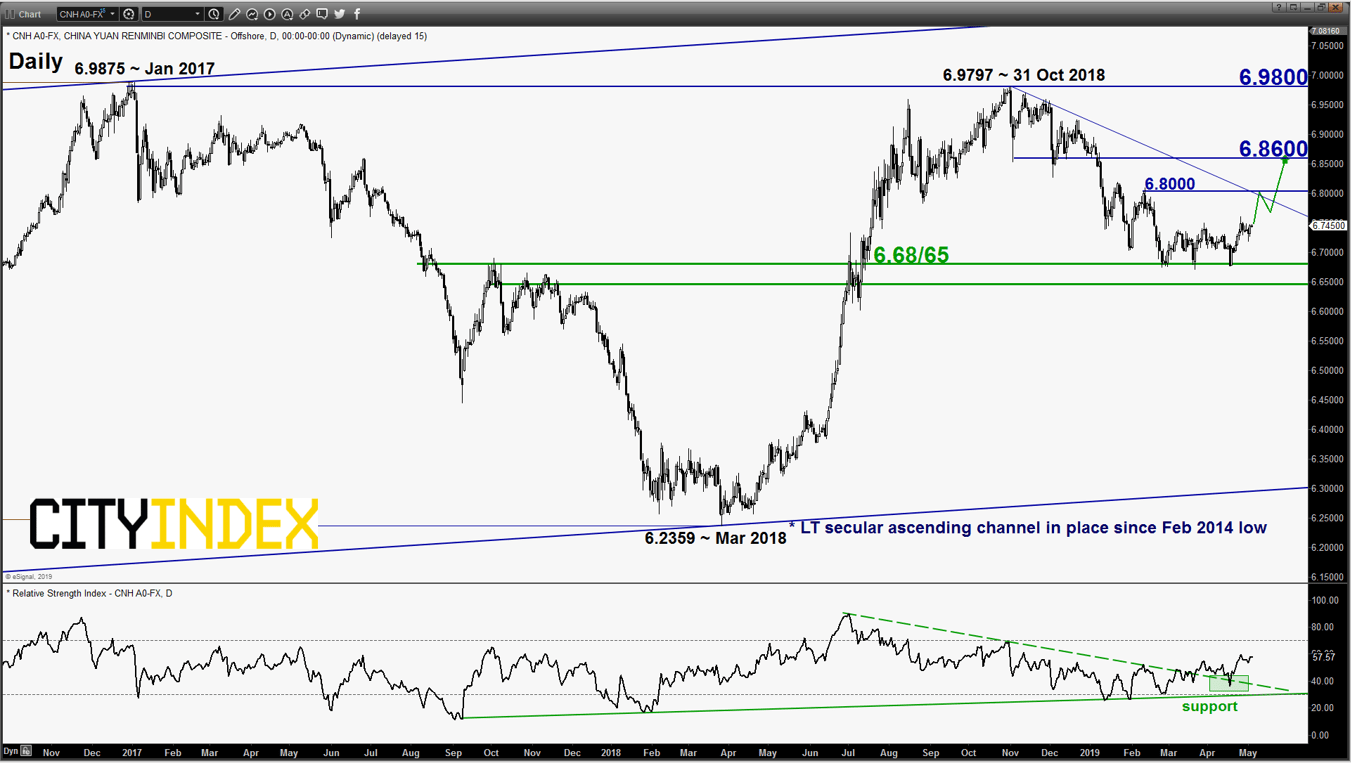
- The decline from its major swing high of 6.9800 has managed to halt at a key medium-term support zone of 6.68/65 (the former swing high area of 26 Sep/17 Nov 2017 & 38.2% Fibonacci retracement of the entire up move from 27Mar 2018 low to 31 Oct 2018 high).
- Momentum has turned positive as indicated by the daily RSI oscillator.
- A break above 6.8000 on the USD/CNH is likely to see a further potential push up to target the next intermediate resistance at 6.8600.
iShares Emerging Markets ETF (EEM) – Under downside pressure
click to enlarge chart
- A potential bullish breakout seen in USD/CNH is likely to lead to further weakness seen in the emerging stock markets given their strong degree of correlation.
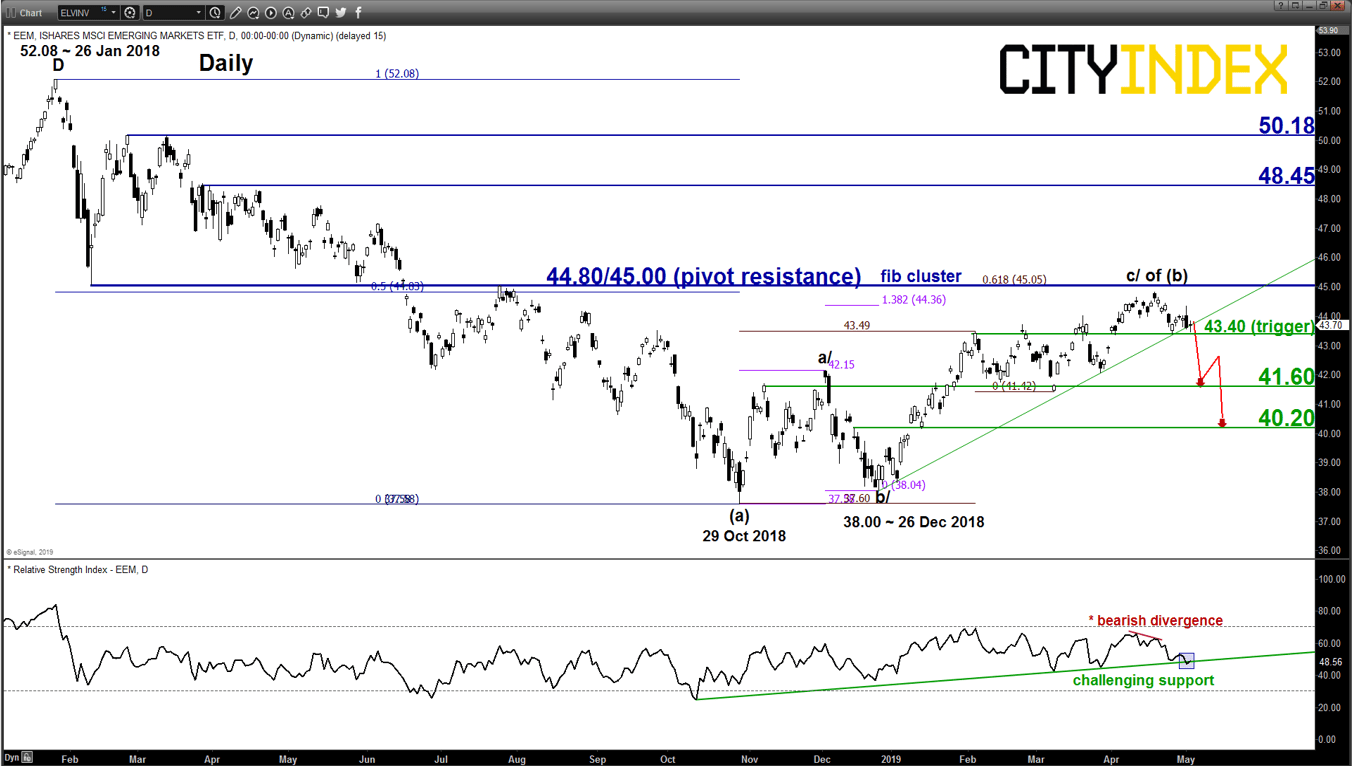
- Momentum remains weak on the EEM as indicated by its daily RSI oscillator.
- 44.80/45.00 as the key medium-term pivotal resistance on the EEM and a break below 43.40 is likely to open up scope for potential multi-week decline to target the next supports at 41.60 and 40.20.
- On the other hand, a daily close above 45.00 invalidates the bearish scenario for an extension of the corrective up move towards the next resistance at 48.45/50.18
Charts are from eSignal
Latest market news
Latest Indices articles

April 17, 2024 11:00 AM
April 16, 2024 08:00 PM
April 16, 2024 04:54 PM