EM Rundown Dollar at risk against major EM currencies
With a plethora of major central bank announcements out of the G10 this week, traders will be more focused on developed markets than their emerging […]
With a plethora of major central bank announcements out of the G10 this week, traders will be more focused on developed markets than their emerging […]
With a plethora of major central bank announcements out of the G10 this week, traders will be more focused on developed markets than their emerging market rivals, so we wanted to take a moment to reset the technical outlooks for the major EM pairs we follow:
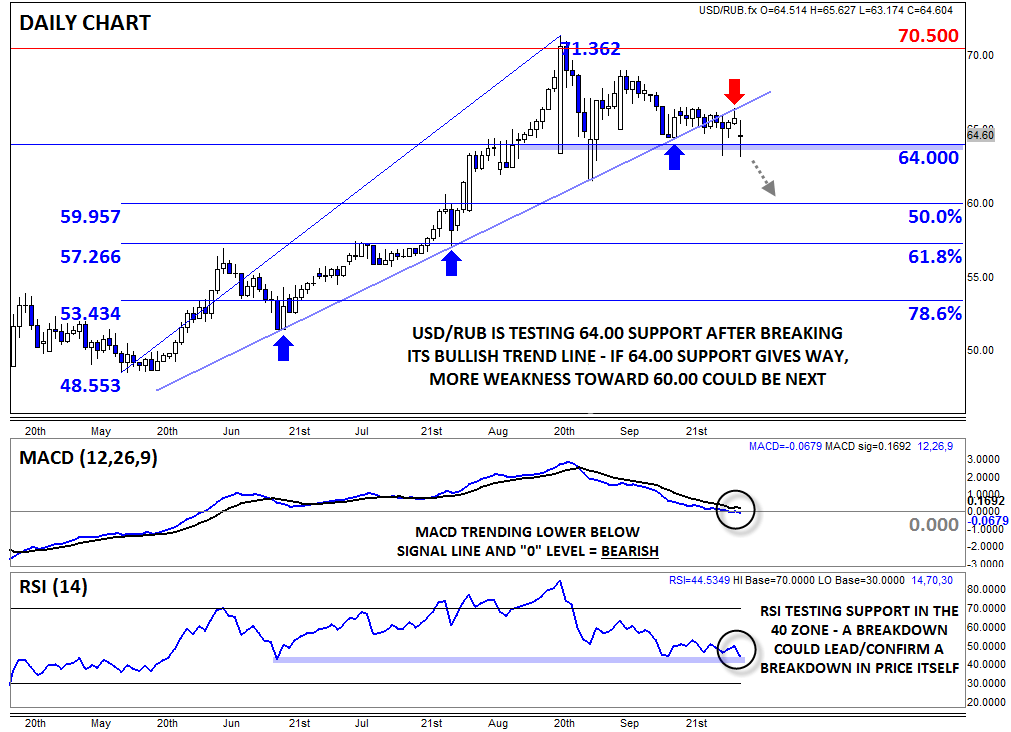
USD/RUB: All eyes on 64.00
The ruble has been a punching bag in this article (and many others) for months now, but there are finally some potential rays of light on the horizon for ruble bulls. USD/RUB broke below its four-month uptrend last week and is now threatening horizontal support at the 64.00 level. Further bolstering the bearish case, the MACD indicator topped out months ago and has now crossed below the “0” level, signaling a shift to outright bearish momentum.
At this point, traders are hyper-focused on the 64.00 floor; if that level gives way, a deeper retracement toward 60.00 or 57.25, the 50% and 61.8% Fibonacci retracements, respectively, would be more likely. Beyond that price level, readers should also monitor the 40 “support level” in the RSI indicator, as a break below that floor could lead or confirm a possible breakdown in price. As long as the 64.00 floor holds, traders may want to adopt a neutral outlook toward USD/RUB.
 Source: City Index
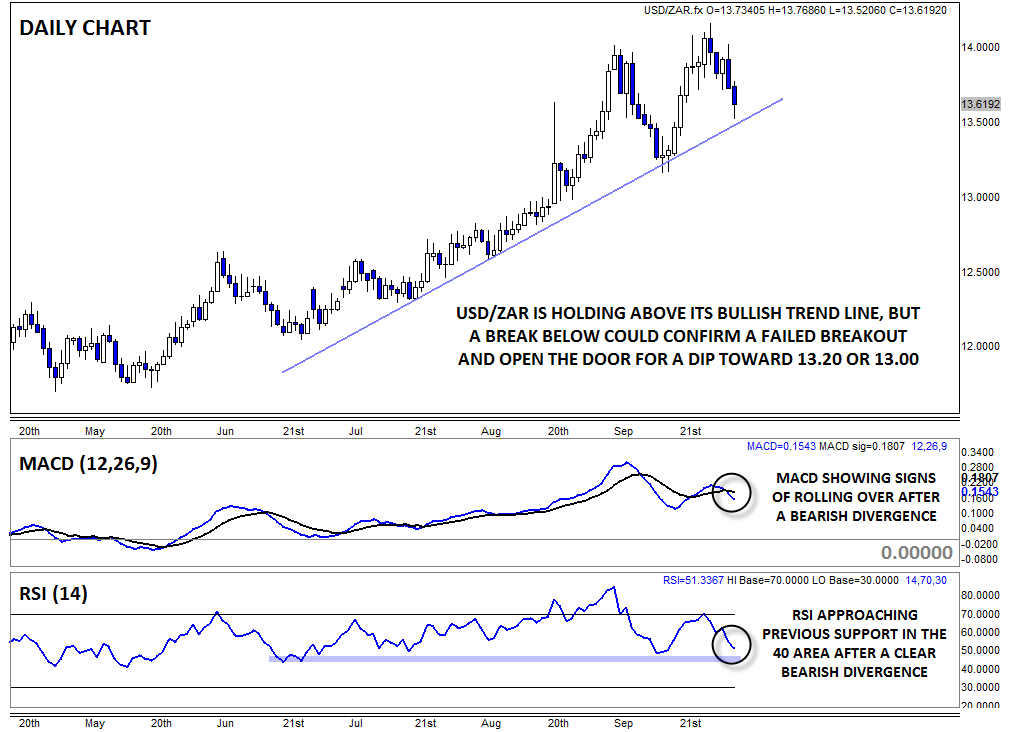
USD/ZAR: Uptrend intact, but risk of a top
In contrast, the USD/ZAR uptrend (i.e. weakness in the South African rand) looks healthy at first glance. The pair is holding above its bullish trend line and actually hit a fresh all-time high above 14.00 just last week, but despite the seemingly optimistic outlook, there are some warning signs beneath the surface.
Notably, the RSI indicator put in a lower high last week, creating a clear bearish divergence in overbought territory. With the MACD also showing signs of rolling over, there is a risk that last week’s high will mark a significant false breakout. From here, bulls need to defend the trend line at 13.50. If that level is pierced, a quick drop back down to previous support at 13.20 or the 13.00 handle could be in play this month.
 Source: City Index
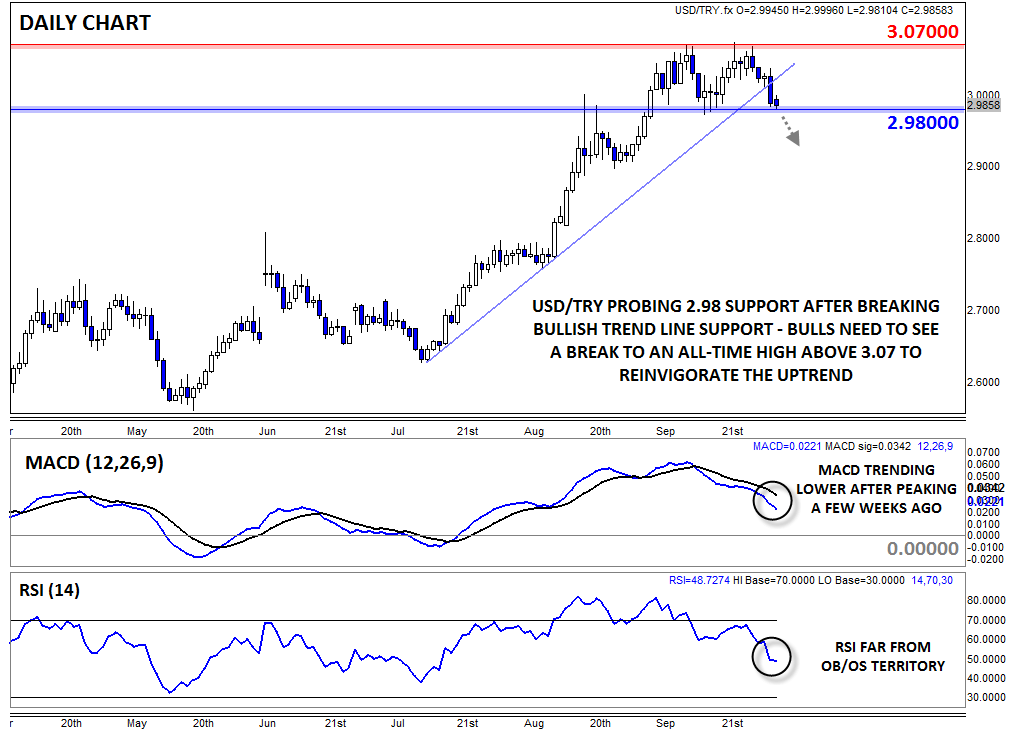
USD/TRY: Back below 3.00…
We won’t spend too long on USD/TRY, as its chart is nearly identical to USD/RUB. In its case, the most important level to watch will be 2.98, which represents the mid-September low, as well as resistance from the mid-August high. If that level gives way, a deeper pullback toward 2.90 or below becomes likely. On the other hand, a breakout to a new all-time high above 3.0700 could reinvigorate the bullish trend and open the door for a possible move toward 3.10 or higher.
 Source: City Index

