EM Rundown China bears spooked but broader EM data not terrible
For over a decade now, China has been the center of the emerging market world from an economic perspective, and 2016 looks to be no […]
For over a decade now, China has been the center of the emerging market world from an economic perspective, and 2016 looks to be no […]
For over a decade now, China has been the center of the emerging market world from an economic perspective, and 2016 looks to be no different. As we noted earlier today, 2016 is the Year of the Monkey in the Chinese Zodiac, but from the first day’s price action, you might mistake it for the Year of the Bear.
The proximate cause for the carnage was weaker-than-anticipated manufacturing PMI figures; both the official government reading and the “third party” Caixin report came in below the 50 level, indicating that Chinese manufacturing activity continues to decline. In addition to the weak manufacturing figures, the impending expiration of last year’s ban on short selling by large shareholders and a falling currency (see below) contributed to the panic.
The ensuing stock market collapse triggered the “circuit breakers” that are designed to pause trading and allow traders to reflect when markets fall sharply. As is often the case though, these circuit breakers may have actually exacerbated the problem as traders rushed to sell before they were triggered, then continued to jump ship once they wore off. In a few hours, we’ll see whether a longer break – in the form of the market closing for the day – will be enough to calm anxious investors’ nerves.
While traders remain uneasy about China, the broader outlook for emerging markets is more optimistic (or at least less pessimistic). Other indicators, including the Chinese non-manufacturing PMI and business confidence figures, as well as Manufacturing PMI figures from other EMs were solid; these data points should ameliorate concerns about an imminent coordinated slowdown. In fact, Capital Economics’ aggregate EM Manufacturing PMI figure actually ticked up in December, from 49.2 to 49.3.
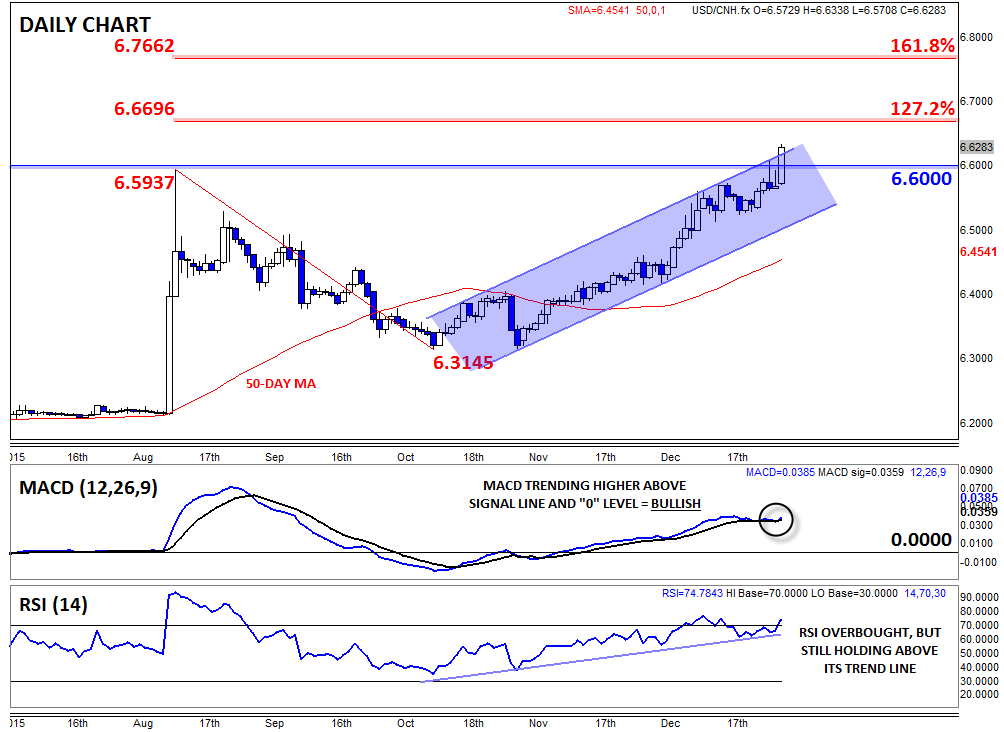
Technical view: USD/CNH
For now at least, traders are selling Chinese assets first and asking questions later. Beyond the aforementioned drop in Chinese equity bourses, the yuan has also seen a big drop to start 2016. Indeed, the “offshore” renminbi (CNH) actually fell to a 5-year low against the US dollar.
With USD/CNH peeking out above the post-August-Chinese-currency-reform high near 6.60, more gains are possible for USD/CNH. The next notable level of resistance is the late 2010 high and 127.2% Fibonacci extension at 6.67, followed by the 161.8% Fibonacci level at 6.766. Of course, a near-term pullback could be in play given the overbought RSI reading, but the medium-term trend in USD/CNH will remain higher as long as rates hold above the bottom of the channel near 6.50.