


Earnings play: Oracle
On Thursday, after market, Oracle (ORCL) is expected to report second quarter EPS of $1.00 compared to $0.90 last year on revenue of approximately $9.8 billion vs. $9.6 billion a year earlier. Oracle is an information technology and software company, and its expected move based on front-month options is 4.9%.
Technically speaking, on a daily chart, Oracle's stock price appears to be consolidating within an intermediate-term symmetrical triangle pattern that began to form in mid-August. Looking to the short-term, one can see that price has just broken out to the downside of a bullish trendline that price has been rising on top of since November 23rd. The RSI is over 50, but pointing downward. The simple moving averages (SMAs) are arranged in a mixed to bullish manner, as the 50-day SMA is above the 20-day SMA and the 20-day SMA is above the 200-day SMA. In the short-term, price will likely fall towards the lower trendline of the symmetrical triangle pattern. If price can reach the lower trendline, price is likely to find support and bounce towards the upper trendline of the triangle. If price can manage to breakout to the upside of the upper trendline then the next targets would be 60.50 and 61.85. There is a support level at 57.50 which traders should be aware of, as price could potentially rebound from there. On the other hand, if price falls below the lower trendline it would be a bearish signal. If price fails to be supported at 55.60, then price could possible tumble further.
Technically speaking, on a daily chart, Oracle's stock price appears to be consolidating within an intermediate-term symmetrical triangle pattern that began to form in mid-August. Looking to the short-term, one can see that price has just broken out to the downside of a bullish trendline that price has been rising on top of since November 23rd. The RSI is over 50, but pointing downward. The simple moving averages (SMAs) are arranged in a mixed to bullish manner, as the 50-day SMA is above the 20-day SMA and the 20-day SMA is above the 200-day SMA. In the short-term, price will likely fall towards the lower trendline of the symmetrical triangle pattern. If price can reach the lower trendline, price is likely to find support and bounce towards the upper trendline of the triangle. If price can manage to breakout to the upside of the upper trendline then the next targets would be 60.50 and 61.85. There is a support level at 57.50 which traders should be aware of, as price could potentially rebound from there. On the other hand, if price falls below the lower trendline it would be a bearish signal. If price fails to be supported at 55.60, then price could possible tumble further.
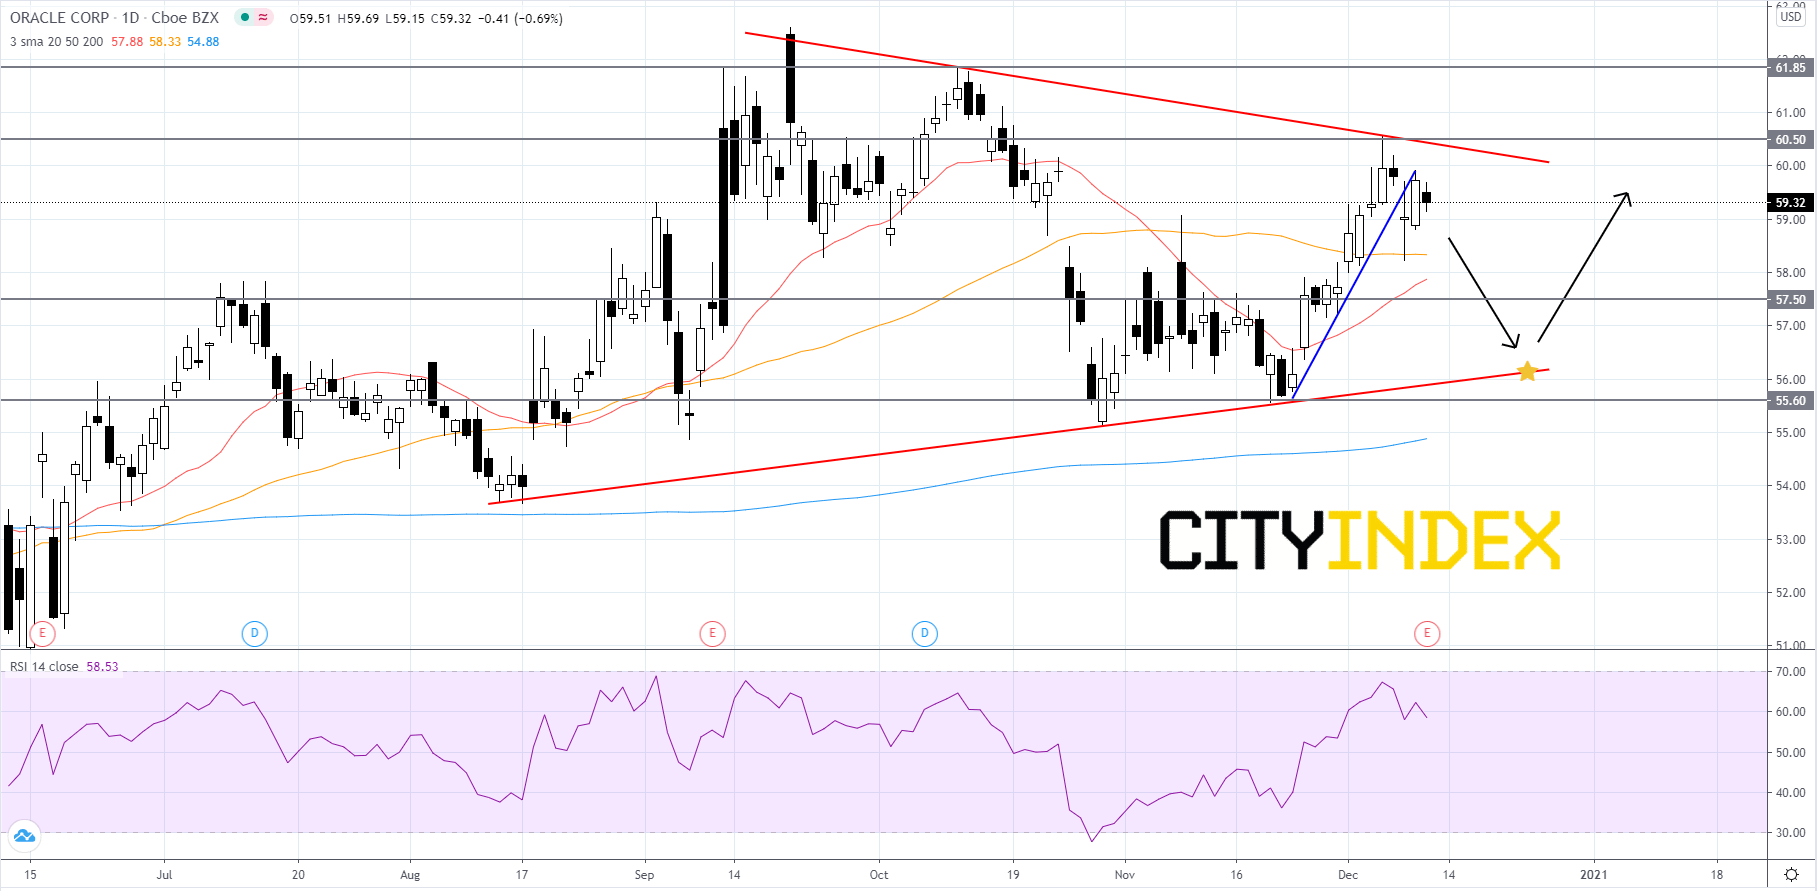
Source: GAIN Capital, TradingView
Latest market news
Today 08:28 AM
Yesterday 03:30 PM
Yesterday 01:23 PM
Yesterday 11:00 AM
Yesterday 08:15 AM
Latest Tech Stocks articles
October 19, 2023 09:47 AM
October 18, 2023 12:06 PM
October 11, 2023 02:41 PM
October 3, 2023 12:24 PM