


Earnings Play: Foot Locker
On Friday, before market, Foot Locker (FL) is anticipated to report second quarter EPS of $0.54 compared to $0.66 a year ago on revenue of approximately $2.0 billion vs. $1.8 billion last year. The company operates an international chain of retail stores offering athletic footware and apparel, and its current analyst consensus rating is 8 buys, 13 holds and 1 sell, according to Bloomberg.
Technically speaking, on a daily chart, Foot Locker's stock price has been chopping around inside of a sideways channel that began to form in mid-June. The RSI is mixed to bearish and currently sitting at 44. The moving averages are set-up in a bearish manner. Price will likely break below the 26.50 support level and drop towards the 22.25 support level. If price manages to hold up above the 26.50 level, price may try to retest 31.50 before falling again. If price breaks above the 31.50 level, it may try to reach for the last peak at 35.25.
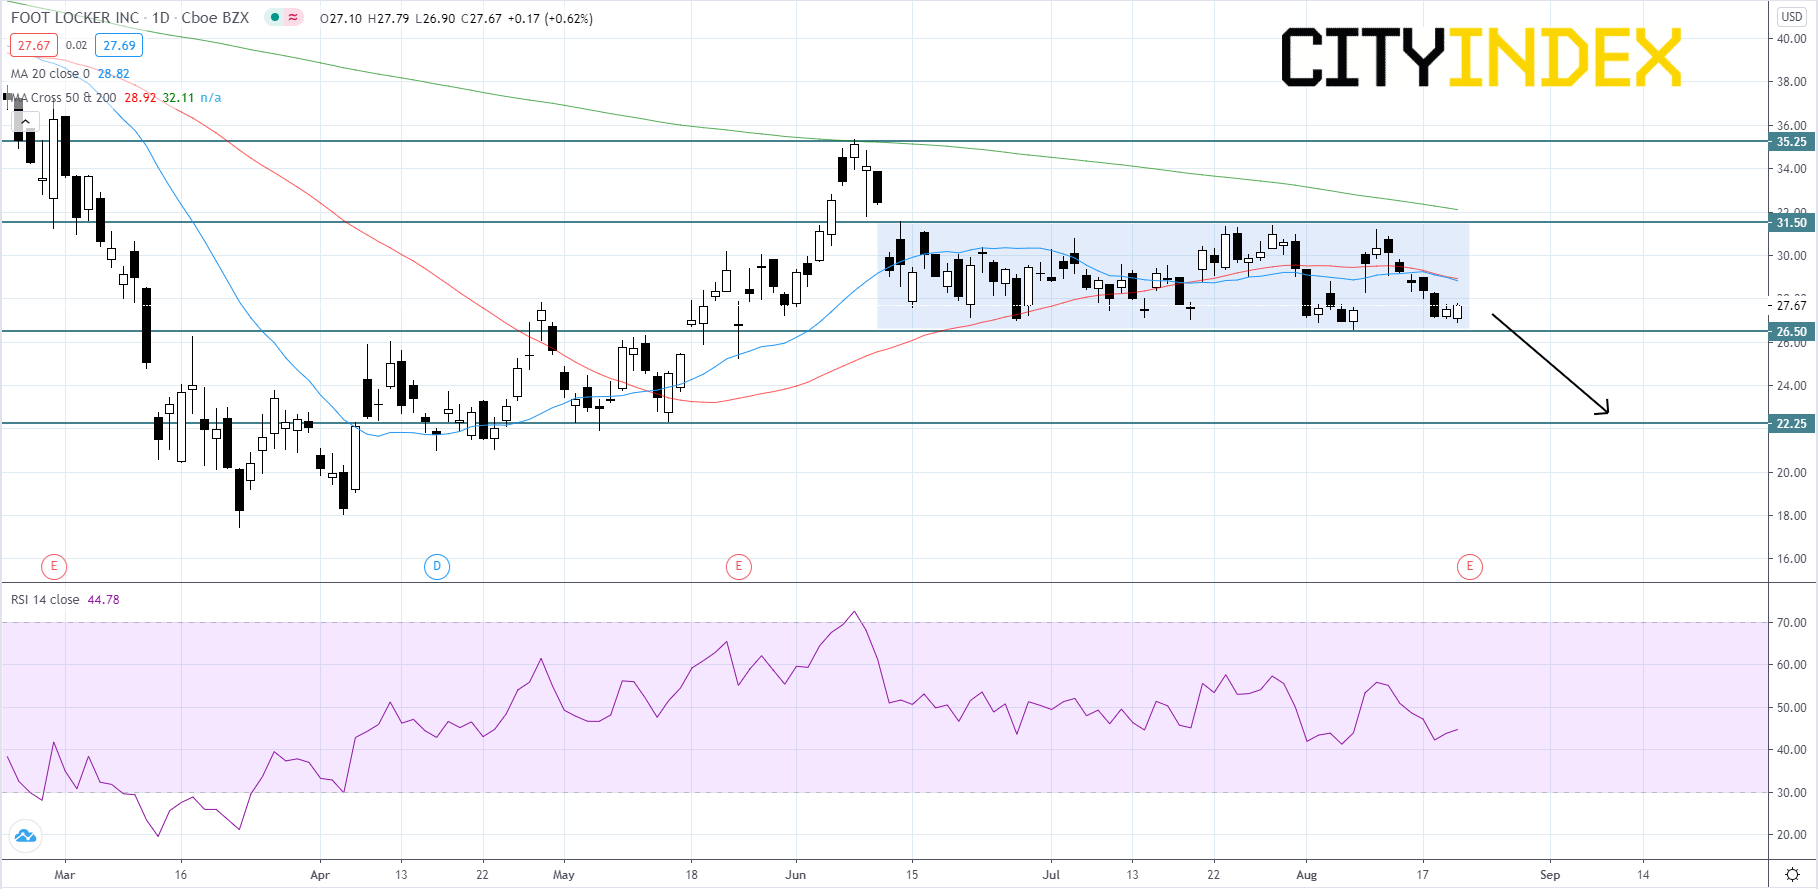
Source: GAIN Capital, TradingView
Looking at a weekly chart, Foot Locker's stock price has been falling inside of a bearish channel since February 2019. Currently price is holding under the upper trendline and will likely hold below it continuing the pattern. However, if price breaks above the upper trendline and begins to use it as support, it could be the start of a new long-term uptrend.
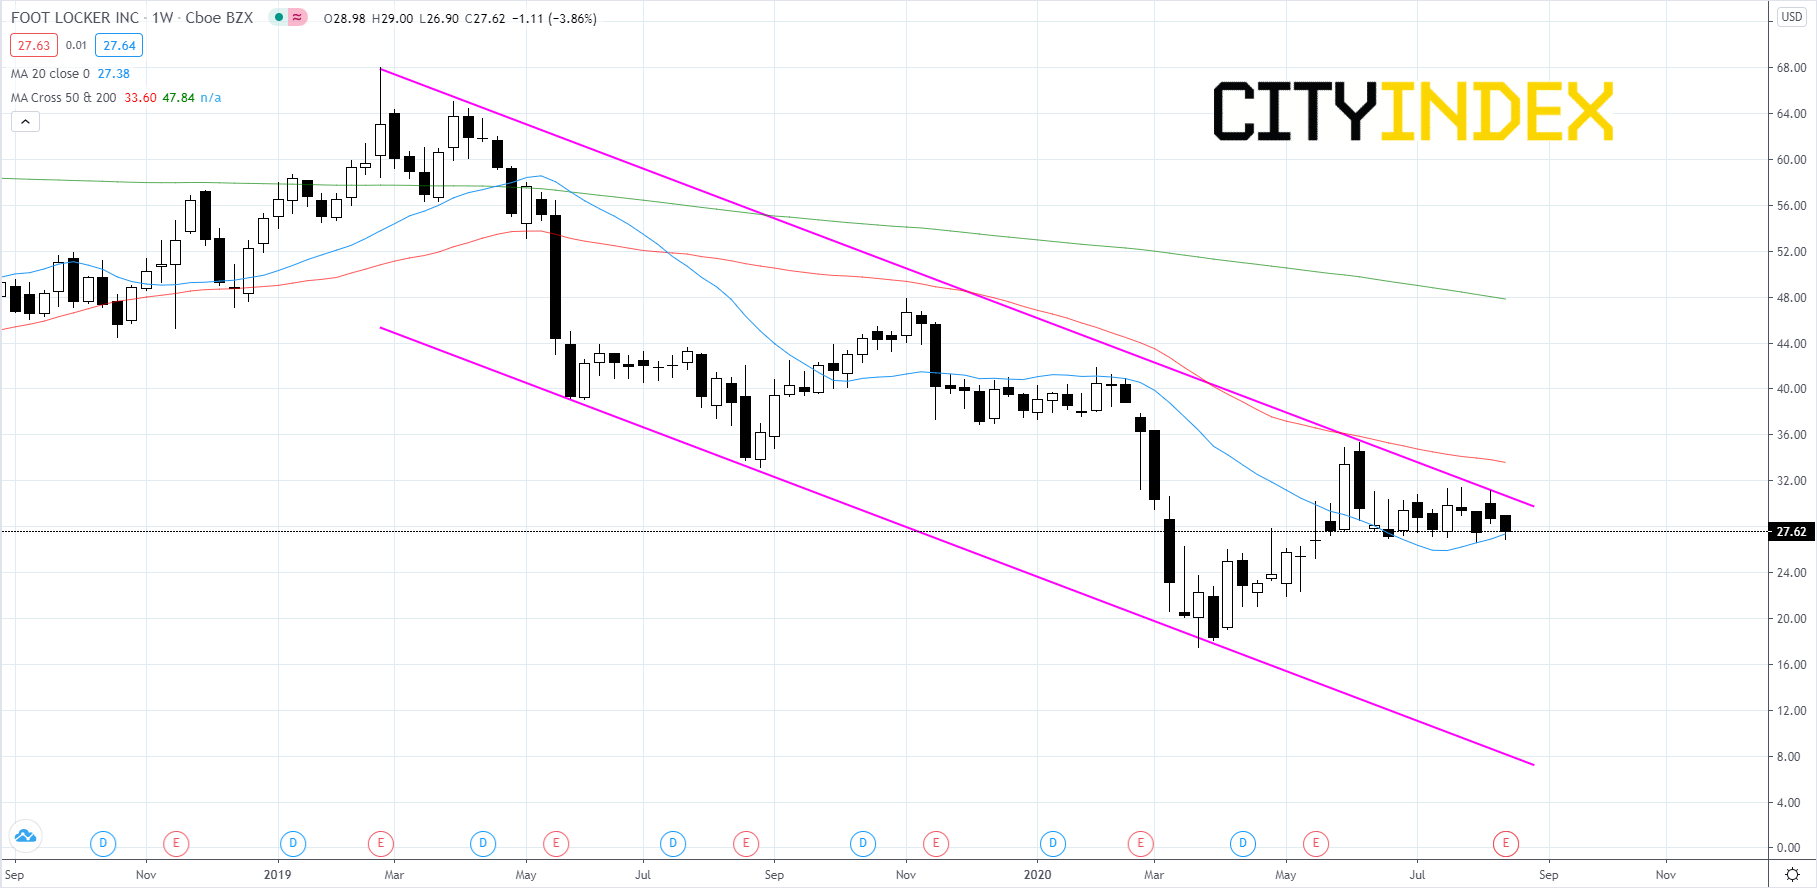
Source: GAIN Capital, TradingView
Technically speaking, on a daily chart, Foot Locker's stock price has been chopping around inside of a sideways channel that began to form in mid-June. The RSI is mixed to bearish and currently sitting at 44. The moving averages are set-up in a bearish manner. Price will likely break below the 26.50 support level and drop towards the 22.25 support level. If price manages to hold up above the 26.50 level, price may try to retest 31.50 before falling again. If price breaks above the 31.50 level, it may try to reach for the last peak at 35.25.
Source: GAIN Capital, TradingView
Looking at a weekly chart, Foot Locker's stock price has been falling inside of a bearish channel since February 2019. Currently price is holding under the upper trendline and will likely hold below it continuing the pattern. However, if price breaks above the upper trendline and begins to use it as support, it could be the start of a new long-term uptrend.
Source: GAIN Capital, TradingView
Latest market news
Today 11:14 AM
Today 08:28 AM
Yesterday 03:30 PM
Latest Equities articles
April 12, 2024 02:28 AM
April 7, 2024 08:46 PM
March 31, 2024 11:22 AM
