Draghi driven drop in equities extends to FTSE
As noted earlier in the day, European Central Bank (ECB) President Mario Draghi’s remarks during Thursday’s ECB press conference prompted a rather abrupt sell-off in […]
As noted earlier in the day, European Central Bank (ECB) President Mario Draghi’s remarks during Thursday’s ECB press conference prompted a rather abrupt sell-off in […]
As noted earlier in the day, European Central Bank (ECB) President Mario Draghi’s remarks during Thursday’s ECB press conference prompted a rather abrupt sell-off in global equities and a strong surge for the euro. This was largely due to Draghi’s assertion that he did not anticipate a need for further rate cuts. Although he vaguely qualified this statement by saying that the situation could change if new developments were to arise, market participants interpreted his remarks as closing the door on further stimulus.
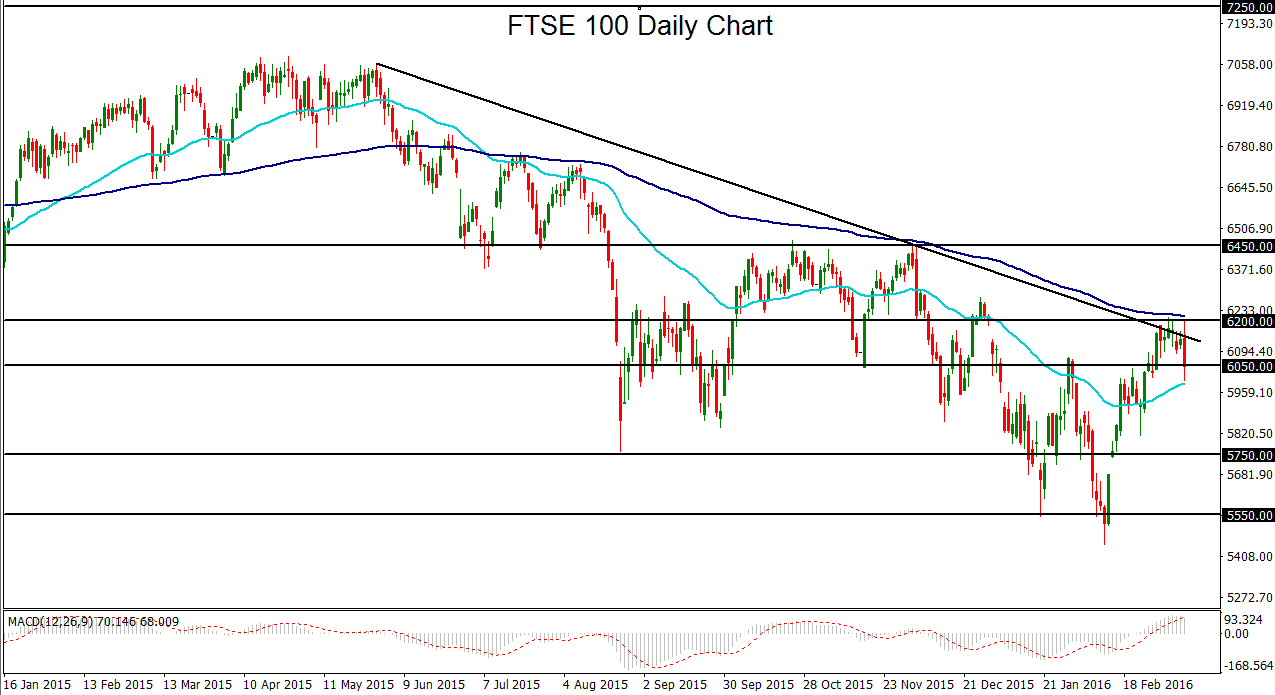
Besides the dramatic upswing for the euro, perhaps the most notable market reaction to these remarks was a plunge in European and US equities. Along with the German DAX and US benchmark indices, this drop could be readily seen on the FTSE 100 chart, which retreated sharply from a major confluence of resistance around the 6200 price level.
For the past month, the FTSE has been rising up from its February multi-year lows. In early March, the index reached the noted 6200 resistance level, but has since been unable to breach this important level. Also serving as resistance before Thursday’s plunge was the key 200-day moving average, which has served as a major resistance factor since mid-year last year. Additionally, a well-defined downtrend resistance line extending back to last May’s 7060-area high has also helped to reinforce the resistance area within the past week.
This technical confluence of resistance has worked well in conjunction with Thursday’s Draghi-driven disappointment to sustain the recent downtrend that has been in place for the past nine months. If this resistance area continues to hold in the event that the FTSE remains pressured, any downside follow-through below the 6050 support area and then the 50-day moving average could open the way for a further tumble towards February’s lows. In this event, the next major downside target is around the 5750 support area. Any unexpected breakout above the noted resistance area would invalidate this technical trend outlook.