Dow Jones arrives at key juncture
Today is the second last trading day of the week for stocks ahead of the Easter break, and there’s little further data to provide significant […]
Today is the second last trading day of the week for stocks ahead of the Easter break, and there’s little further data to provide significant […]
Today is the second last trading day of the week for stocks ahead of the Easter break, and there’s little further data to provide significant direction. The focus will be on the official weekly US oil inventories data later today. Stockpiles have been rising relentlessly despite signs of lower oil output in recent months. Last night, the American Petroleum Institute (API), an industry group, again reported a sharp build of 8.8 million barrels for the prior week. This was much higher than expected, although it didn’t cause a notable decline in oil prices. However, if confirmed by the official data from the Energy Information Administration (EIA) later this afternoon then this could pressurise oil prices, which in turn may have an impact on commodity stocks. But it should be noted that during this time of the year when refineries carry out their maintenance works ahead of the driving season, inventories do tend to rise. Thus, a bigger surprise would be if we see a drawdown, or even a small build. In this case, oil and possibly stocks could extend their recent gains. The other key US data to watch for the remainder of this week includes durable goods orders tomorrow and the final GDP estimate on Friday. From Europe, this week’s key remaining data includes the German Gfk Consumer Climate survey and the ECB’s Target LTRO results, both tomorrow. The start of next week will also be a slow one as far as the economic calendar is concerned, but things should pick up later on in the week with the monthly US jobs report scheduled for release on Friday April 1.
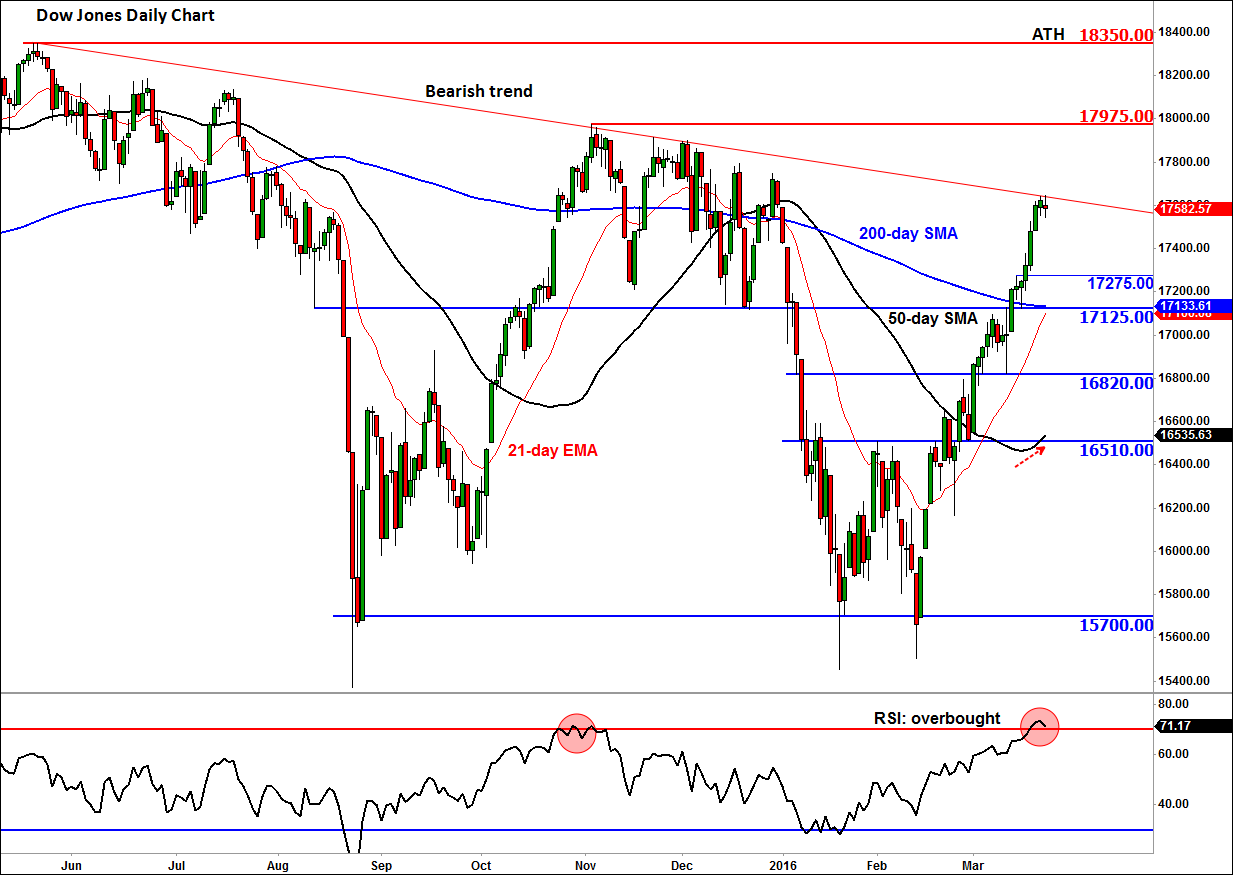
Because of the lack of significant data in the interim, technical analysis will garner more attention than usual, especially as the lower expected volumes over the coming days should make the markets more vulnerable to sharp moves and more headline-driven. On this front, the daily chart of the Dow Jones Industrial Average is an interesting to watch. It has been the best performing US index this year, undoubtedly due to the performance of the commodity stocks (as a result of rallying oil prices) that make up a large portion of this index. And overall the market conditions are favourable for the bulls, given the extremely low and negative interest rates as well as other nonconventional stimulus measures such as quantitative easing from some of the major central banks.
But a short-term pullback looks likely now that the Dow has reached a key level around the 17640/50 area, which corresponds with a bearish trend line off the previous record high, while the RSI momentum indicator has climbed above the “overbought” threshold of 70. So, there is potential for a pullback here, in part due to profit-taking from the longs. The sellers are only likely to show up in force if and when the index forms a reversal-looking candlestick pattern on the higher time frames such as the daily chart.
However, the bulls would argue that a pullback at this stage would actually be a positive outcome as it would allow the oscillators to work off ‘overbought’ conditions. The 50-day moving average is pointing higher and the 200 is flattening. So we could see a short-term pullback, potentially towards support levels at 17275 or 17125, before the rally resumes. Otherwise, a continuation of the rally towards the early November high at 17975 could be likely. The bulls may wish to proceed with extra caution over the next several days while the bears need to wait for some confirmation.